Trading Articles
Volume, The Forgotten Oscillator By Martha Stokes
This oscillator can expose the amount of energy behind a price move. Most traders know the popular price oscillators: stochastic, the relative strength index (RSI), Williams’ %R, price rate of change, and so forth. Price oscillators are second only to the moving average convergence/divergence (MACD) in popularity and use by retail traders. But few traders know about or use volume oscillators, a far more important category. While price oscillators are used mostly to reveal overbought and oversold price conditions with a high and low percentage range, volume oscillators can help identify the energy behind the move.
VOLUME OSCILLATORS
Volume oscillators can expose market energy of all kinds as well as reveal the shift of energy from up to down and vice versa. Being able to identify an increase in volume (which indicates increasing energy for the stock) or a shift in direction can help the short-term trader determine the duration and sustainability of the current price action. This can help screen out weaker stock picks and ascertain when to exit a trade. In today’s institutional activity–based market, the volume oscillator can reveal buying and selling patterns before price begins a major move. This is because many of the large institutions are careful not to disturb price as they buy incrementally.
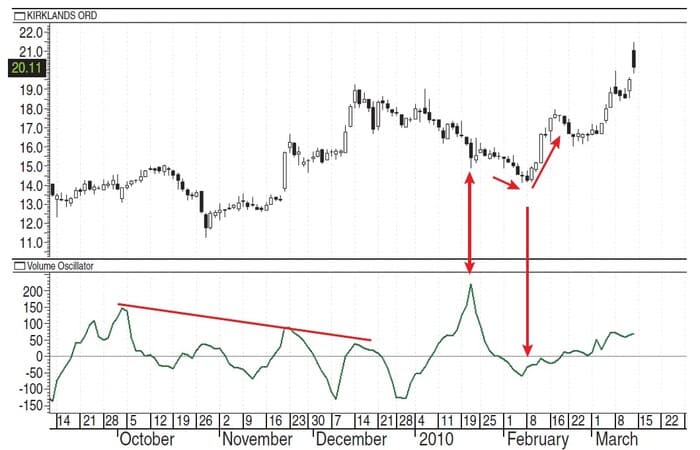
On the daily chart of Kirk-lands, Inc. (KIRK), as price moves up during the October–December period, the volume oscillator pattern forms lower highs, indicating a weakening of upside energy (Figure 1). However, a spike exhaustion pattern during the correction in January forewarns of an exhaustion pattern to the downtrend as high-frequency traders sell short for one day and then move on. The February volume oscillator cycle fails to bottom and the upside price action resumes. By studying these patterns carefully, the retail trader can anticipate and prepare for reversals and retracements prior to price actually changing.
HOW THE FORMULA WORKS
The standard volume oscillator available for most charting software is a center line oscillator. Instead of oscillating between a high range and a low range the way most price oscillators do, center line volume oscillators move above and below a zero line. The center line exposes the volume energy behind the price action for both buy and sell sides. By watching the volume oscillator as well as a pure price oscillator such as stochastic, traders take their analyses to a more analytical level to anticipate price changes before price reverses on the short-term trend. Being able to anticipate price action well ahead of the event is a decided advantage when the market is moving with velocity.
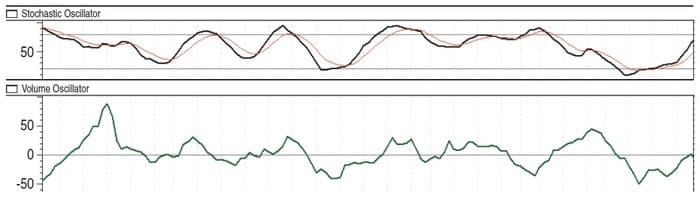
The example you see in Figure 2 of the volume oscillator formula turns at the zero line. The formula calculates the percentage of deviation from an exponential moving average (EMA) to identify significant changes to volume for this particular stock. The EMA can be adjusted in the formula to adapt to trading styles and the current market condition. In this example, the short-term EMA is set at 12 periods and the long term is set at a 28-period EMA with a time series method.
The volume oscillator is an advanced analysis tool that aids in identifying underlying changes to short-term sentiment. Volume oscillators are ideal for professional high-frequency traders, day-traders, swing traders, and velocity traders. Position traders may also find this indicator useful during platform market conditions.
EXTREME PATTERNS
As with all indicators, the volume oscillator can indicate extreme patterns to both the upside and downside action. Extremes warn of a change in direction for the short-term price action. Extreme ranges occur when the oscillator exceeds its normal range. The oscillator will move sharply to the top or bottom of the chart, often forming a near-vertical angle of ascent or descent. Figure 3 of Caterpillar (CAT) shows how the volume oscillator exposed the weakening volume action prior to the forming of a top.
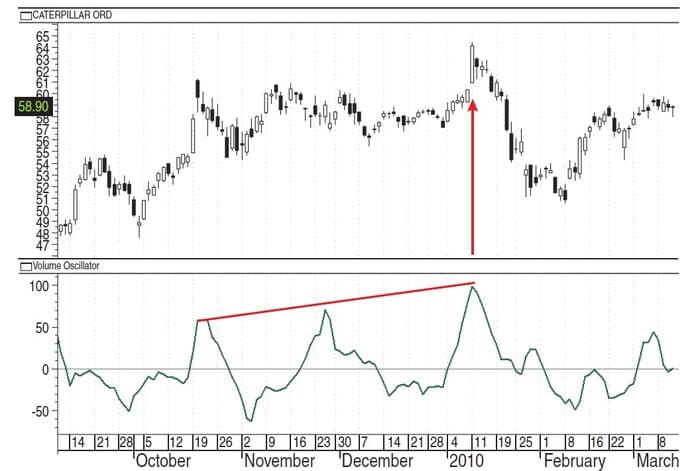
The exhaustion pattern on the volume oscillator occurs just before a topping action as the last surge of late buyers rush in on speculation and as high-frequency traders trade the stock intraday in January. The spiking pattern moves well beyond the normal range. The subsequent peak fails and forms a significantly lower high in February and March.
HOW AND WHEN TO USE IT
There are numerous ways you can use a volume oscillator to speed up your trade analysis. Volume oscillators aid in the analysis of volume bars as seen in the chart of IBM in Figure 4. The volume oscillator exposes cyclical patterns as well as extreme readings that may not be as evident in volume bars alone. The volume oscillator is easy to read with its center line.
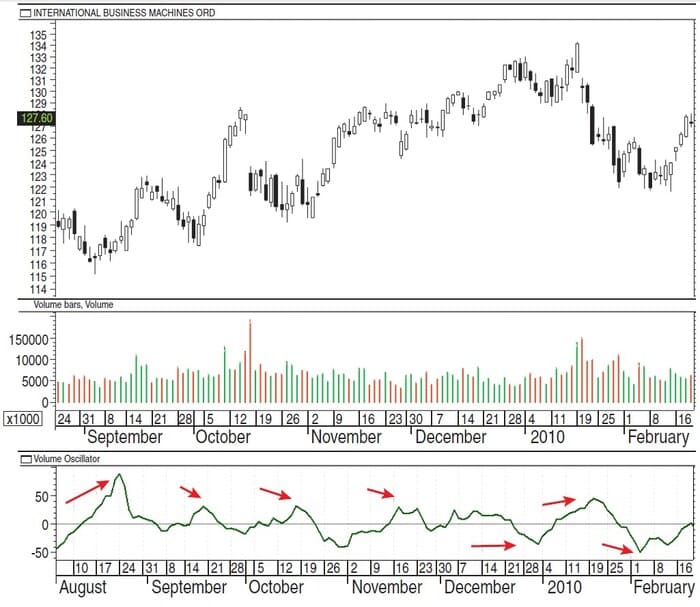
As the volume indicator moves up above the center line, it indicates accumulation or rising interest in the stock to the buy side. As long as the indicator remains above and/or oscillating near the center line, buyers will dominate stock activity and the bias will remain to the upside on the short-term trend. When the volume oscillator heads down and moves well below the center line, a distribution or selling pattern is occurring. For short-term trading, this can be profit-taking after a big move up.
CONTRADICTING PRICE OSCILLATORS
One of the most important advantages when using a volume oscillator in conjunction with a price oscillator such as stochastic or the RSI is when a contradiction occurs between the volume oscillator and the price oscillator. Such contradictions are known as divergences or convergences between indicators. In Figure 5, you can see an example of a contradiction between the stochastic and volume oscillator. The stock is building a platform, a common sideways pattern that develops as institutional investors move into a stock without moving price out of a tight range. Institutional investors are the most dominant of the eight market participant groups and their activity often goes unnoticed because they use controlled bracketed orders that maintain price at certain levels.
Stochastic is dropping below its overbought 80% line while the volume oscillator is heading upward as the platform develops. This creates a convergence pattern between the stochastic and the volume oscillator. This pattern is a leading indication that the platform will break to the upside, which can be a critical piece of information for position and swing traders, trading platforms, and earning strategies.
Suggested Books and Courses About Market Indicators

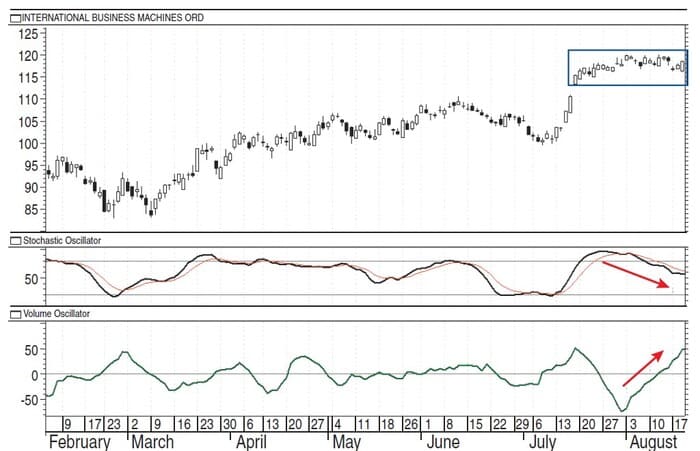
Platforms are common sideways patterns that form after bear markets and intermediate-term corrections and during value-oriented market conditions. These slower-moving uptrends build lengthy tight sideways action that tends to follow earnings reports during slower economic and business cycles. IBM formed a lengthy platform during August and September in Figure 6. Stochastic floated from late July to early August and then slipped downward during the platform stage.
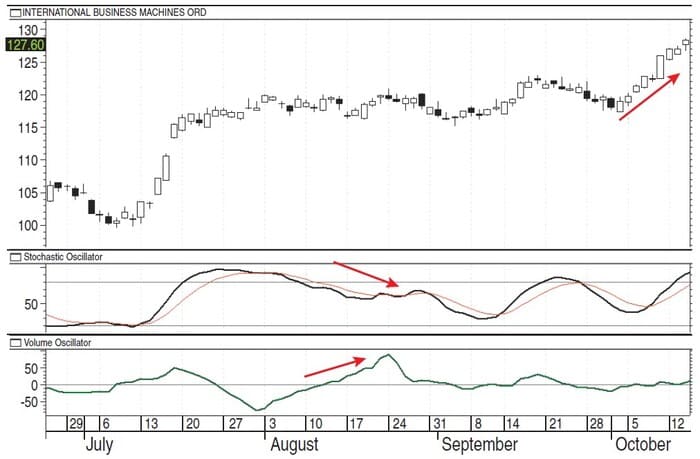
However, the volume oscillator continues to rise during this period, followed by an upside breakout move in October. The value-oriented market creates a slower platform-building pattern for most stocks. Being able to see the activity of the institutional investor moving in before price moves helps traders enter these platforms prior to breakout moves, gaps, and runs.
FLOATING STOCHASTIC AND VOLUME OSCILLATOR
During moderately trending markets, when most price oscillators fail to oscillate but form a floating pattern at their overbought line, a volume oscillator can be an invaluable analysis tool for swing and velocity traders, exposing weakening price action before a retracement. The chart of Tam (TAM) in Figure 7 shows a spike on the volume oscillator during a platform and prior to the move up.
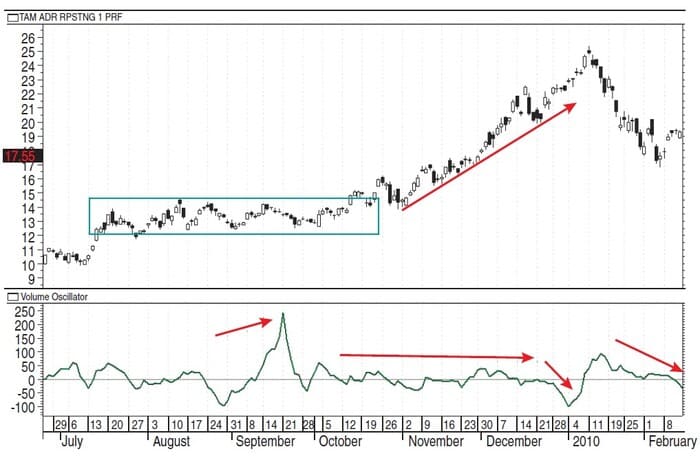
This is often indicative of heavy institutional investor activity that tends to use controlled bracketed orders that do not move price during the accumulation phase. As the stock moves up, the volume oscillator hovers around its center line, indicating steady consistent volume activity until December when the volume oscillator suddenly forms a divergence with price, just prior to the topping action.
VOLUME OSCILLATOR AND GAPS
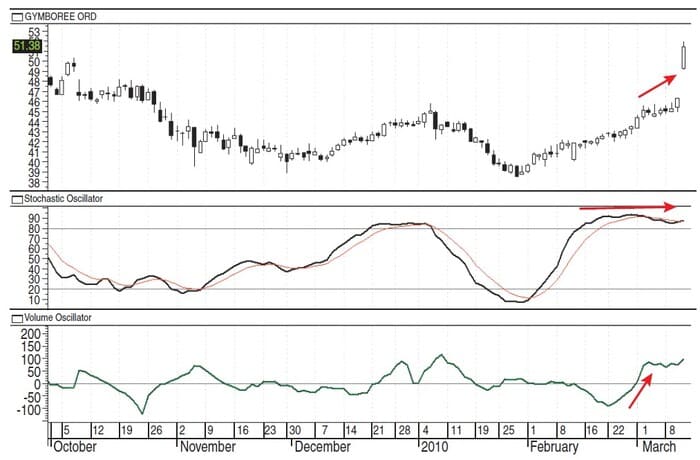
Platforms and bottoms often have huge gap-ups due to institutional short-term and high-frequency traders who trade speculatively when they discover that their counterpart, the institutional investor, has been accumulating. Their large-lot speculative buying patterns drive price up in sudden, explosive moves. The volume oscillator can be a useful tool in finding stocks poised for a huge gap or runaway price action. In Figure 8, in the chart of Gymboree Corp. (GYMB), you see a floating stochastic as the volume oscillator turns upward and moves above its center line. Although price is sideways, volume is building energy during this bottoming phase.
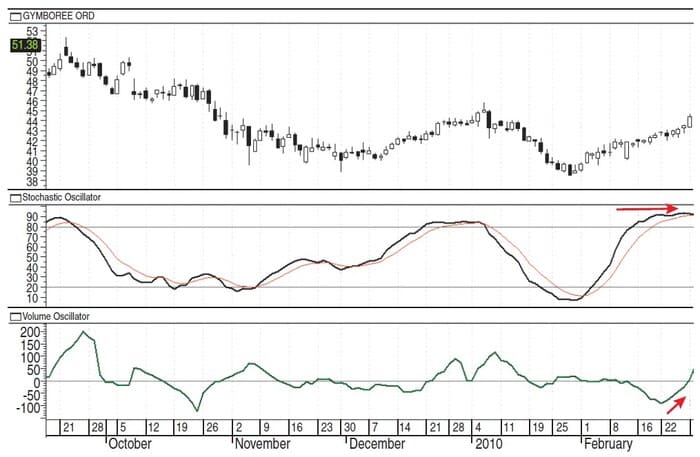
Figure 9 shows the gap that formed on GYMB shortly thereafter. The volume oscillator indicated heavy buying activity in GYMB prior to the huge gap. Stochastic was in a momentum floating pattern that did not signal to enter the stock at that time. By using the volume oscillator with stochastic or any other price oscillator, the swing and velocity trader is able to enter the stock prior to the gap price action, thereby increasing their profits significantly.
BUYING EXHAUSTION PATTERNS
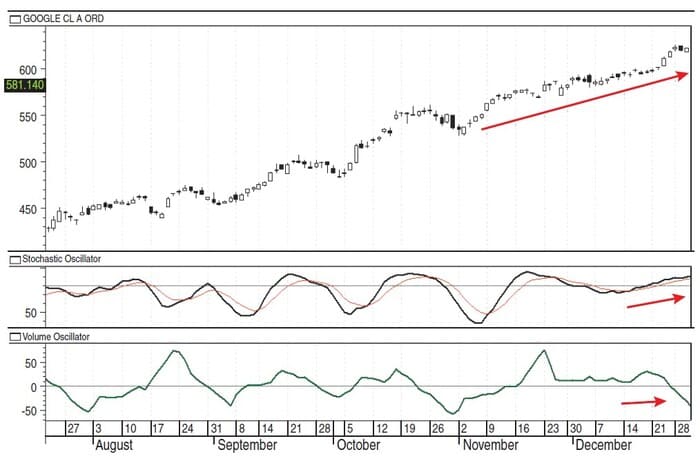
During velocity (that is, momentum) trades, the volume oscillator can fore-warn of a buying exhaustion pattern even while stochastic floats, signaling early that the run is losing energy as price advances upward. In Figure 10 you can see that a negative divergence between price and volume has occurred, indicating early that price action is losing energy.
SUBINDICATORS WITH VOLUME OSCILLATOR
A variety of sub-indicators can be applied to the volume oscillator to facilitate in faster analysis and more subtle nuances of the indicator cyclical patterns. For short-term trading (such as intraday, day-trading, swing, or velocity), the use of an EMA, rate of change, or linear regression lines applied to the volume oscillator to create another indicator line can be useful to further sharpen the analysis process. Convergence and divergence patterns between the volume oscillator and the sub-indicators can help a trader enter or exit the stock more quickly before a sudden price move.
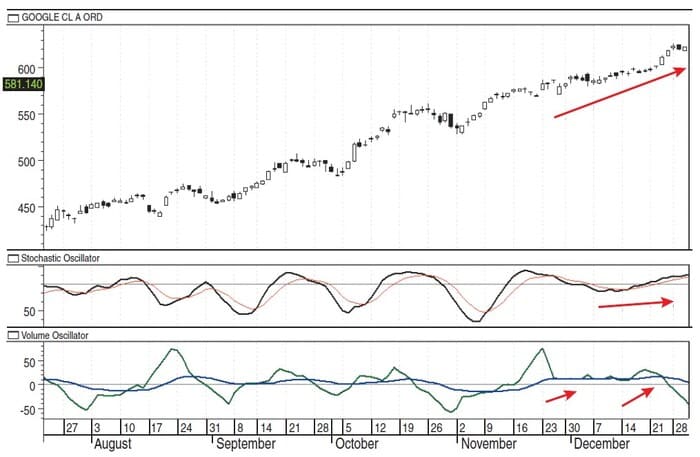
The chart of Google (GOOG) as shown in Figure 11 reveals an EMA applied to the volume oscillator. The 25-day EMA exposes the weakening pattern for the volume oscillator even before the volume oscillator moves below its center line. This gives a short-term trader extra time to plan the best exit strategy.
SUMMARY
The volume oscillator can be an additional analysis tool to use with price oscillators to help expose strengthening or weakening volume patterns that often precede changes to price action and direction. As with all indicators, the volume oscillator requires study and practice to use it properly and learn its nuances. Extreme oscillation patterns can reveal shifts of sentiment and bias from buyers to sellers and from short sellers to buyers. The indicator is ideal for short-term trading styles and can show buying patterns of the institutional investor during platform markets when price appears to be listless. Institutional investors control price through the use of bracketed orders that contain their buy entries within a tight price range. However, the volume oscillator can expose the surge of buying even while price remains in a narrow price range. This allows the retail trader to buy in before the sudden breakaway gaps or large runs out of the platform.
The volume oscillator is an advanced indicator and should be used by traders who have plenty of trading experience and a strong knowledge base of price oscillators and other indicators. Beginning traders, however, will need to first learn price oscillators and various volume indicators before attempting to use the volume oscillator. Adding a volume oscillator to your indicator toolkit can increase your profit potential and help you anticipate a change to price action before it commences.
Martha Stokes is a Chartered Market Technician and a member of the Market Technicians Association (MTA). The author of Cycle Evolution Theory and a popular lecturer, Stokes is a master-rated technical analyst for Decisions Unlimited and codeveloper of the TechniTrader stock market trading courses, workshops, and virtual classes. In addition, she writes several educational newsletters for active traders.