Trading Articles
Volume Analysis With the SPY By Domenico D’Errico

When something is trading at or close to its all-time highs, you need to know whether to sell it or continue holding it. Viewing the markets in terms of supply & demand areas is one way to do it. Volume analysis is a form of technical analysis that attempts to look at price action and how it relates to volume. It is similar to Market Profile in that it identifies the price level at which supply & demand are in equilibrium and where it is in imbalance. In this article, I will use the concept of volume analysis to identify relevant supply & demand areas on a chart and use them as my entry or exit points.
Volume Area and POC
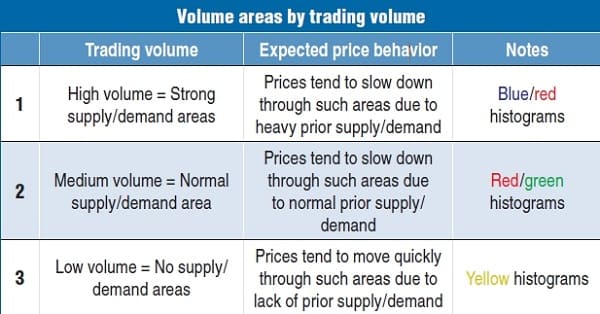
As you can see in Figure 1, there are three different types of volume area. These are based on volume traded.
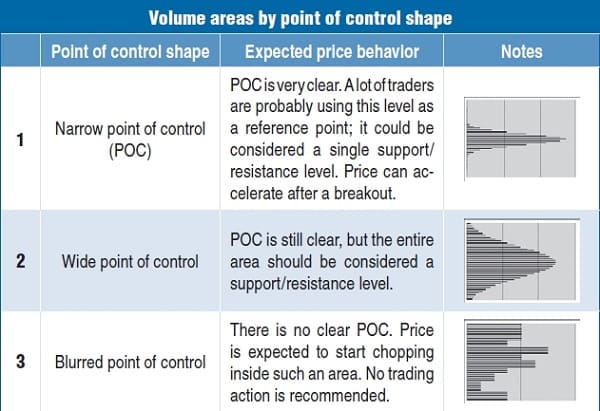
In addition, the shape of the point of control (POC) can provide traders with additional information (Figure 2). You can have a narrow POC, which suggests that a lot of traders are using this level as a reference point. You can think of it as a support or resistance level. A wide POC isn’t as concentrated as a narrow one, so your support & resistance level is a much wider price range. Sometimes there’s no clear POC, which means it’s best to not trade when you see that happen.
Spy Volume Analysis
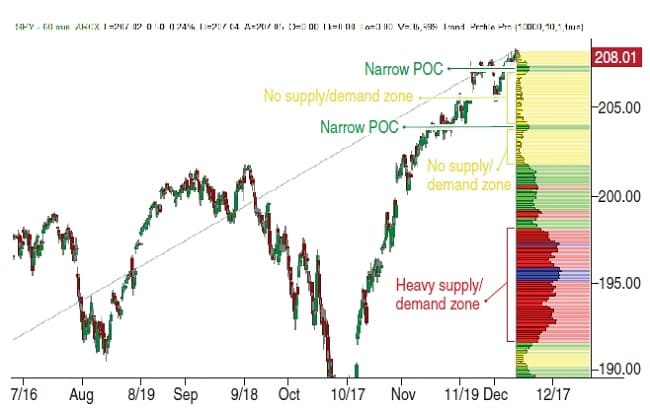
Using Trend Profile Pro, a TradeStation add-on, I’ll focus on the SPDR S&P 500 ETF (SPY) swing price movement that started on February 5, 2014 and ended on December 5, 2014 (price range $175–208). On December 5, 2014, the volume profile looked similar to what you see in Figure 3.
Suggested Books and Courses About Chart Patterns


You’ll notice that volume is displayed as horizontal histograms at various price levels and are colored according to the criteria in the table in Figure 1. Let’s see this in terms of relevant supply & demand areas:
- A narrow POC detected at 207.4
- A no supply/demand area at 204–207
- A narrow POC at 204
- A no supply/demand area at 202–204
- A heavy supply/demand area detected at 192–198
What Happened Since Then?
On the hourly chart of the SPY in Figure 4 you can see price action following the December 5, 2014 analysis.
- December 8, 2014: A first down movement broke level 207.4 and quickly went down through the yellow area (204–207); it was rejected at the 204 level.
- December 10, 2014: A new down move temporarily broke the 204 level.
- December 11, 2014: A strong down leg broke below the 204 support level, sharply went down through the yellow area from 202–204, and was rejected by the top of the 192–198 area.
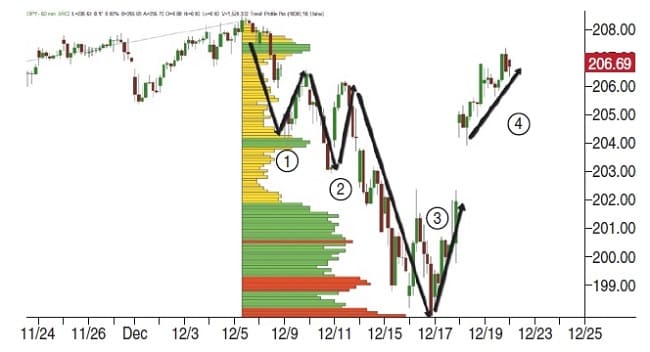
What’s Next?
At this point the SPY is attempting another rally, but any long-term view needs to be confirmed by price breaking out and holding at the 207.4 level. On December 23, 2014, price was in the middle of a no supply/demand area, meaning that volatility would be expected to remain high for the next trading sessions. The 204 level could still be considered a good stop-loss for existing long positions or a stop & reverse for aggressive traders keen to open short positions. Should the price come down into the heavy demand area at 192–198, it is likely that the downward price movement could slow down due to heavy prior volume activity.
Volume analysis identifies relevant supply & demand areas on a chart that you can use for entry or exit points.
Keeping an eye on price action in relation to its volume activity can give you an indication of the strength of a trend. It will also help you identify support & resistance levels. These will help you in making better entry and exit decisions.
Domenico D’Errico is a TradeStation platform developer and a two-time winner of the TradeStation developer challenge. He works as an advisor for asset managers and professional traders from different countries. He has a background in statistics.