Trading Articles
Gann Vibration Table Analysis of Tops, Bottoms, and Price Cycles
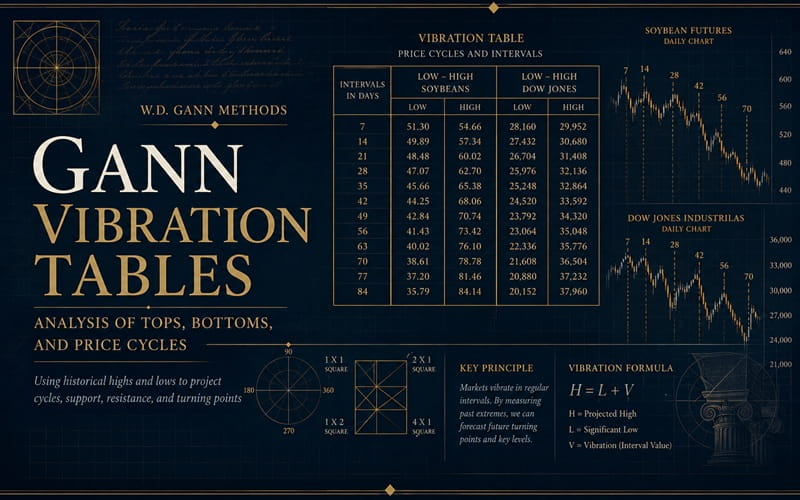
Another easy, yet very powerful application of a Gann principle is what I call the “Vibration” Table. In the Financial Times 1909 Gann article (which I’m certain you’ve read), Mr. Gann described each commodity and stock as having it’s own unique vibration”. The table is a series of fixed prices at increasingly higher levels that are not only strong support and resistance but often turn out to produce THE major top (or bottom) price that ends bull and bear markets.
The construction of a Vibration Table is grade school simplicity. The all-time lowest price of a commodity contract or stock is divided into eighths and thirds beginning at “0” and added TO ITSELF, creating higher and higher “cycles” of price; all prices in the series derived from the same historic starting number. That’s all there is to it. But the underlying Gann principle, that there is an unchanging mathematical relationship between historic lows and subsequent highs that is continuous through time, is as powerful a market concept as you will encounter.
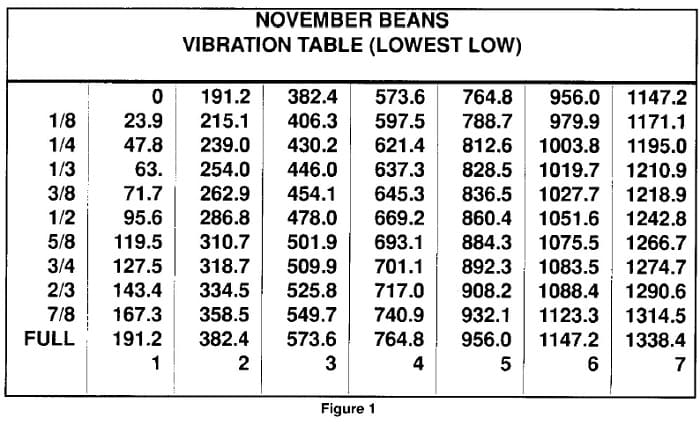
In order to appreciate how dynamic this principle is, let’s examine a Vibration Table based on the lowest price ever made by a November soybean contract. Futures trading in soybeans began in 1936; on February 9, 1950, the November contract made its historic low at price 191 1 4. According to Gann principle, subsequent major highs in November soybean contracts will be mathematically related to the price 191.2. This is true regardless of the number of intervening years between the original lowest low and subsequent highs. This is also one of the key reasons that Gann weekly and monthly charts must be the same contract month year after year — to preserve the mathematical purity for price forecasting.
Referring now to the Vibration Table in figure 1, notice that the original low has been divided into eighths and thirds. The column marked “I” begins at “0” and ends at the lowest low, 191.2. Column “2” is 191.2 ADDED to 191.2 and also divided into eighths and thirds. Column 3 is 191.2 times three or as I shall refer to it — “3 Cycles of the Low.” As in all cases with either Price or Time, Gann ranked the divisions into eighths and thirds in importance from the most important — End of Cycle — the next, midpoint or 50%, then 1/3, 2/3 and finally the 1/4’s and 1/8’s.
Observe the fifth column or “five cycles of the low” which is 956. In October 1974, the Nov. 1974 soybean contract made new historic highs that ended a spectacular bull market at price 956. Not 956 and 1/2 or 1/8 or 3/4 but exactly 956, proving the accuracy of Mr. Gann’s hypothesis some 24 years after the original low was made. This very precise illustration of the Gann “Vibration” principle occurred in modem times during a period of extreme volatility in an inflationary environment. Contrary to popular belief, such fundamental factors have no bearing whatsoever on mathematical relationships — they affect only the price levels.
It was not until 1983 that “five cycles of the low” came into play again as major resistance. The Nov. 1983 contract made low at 568 1/2, just five cents below “three cycles of the low.” It was from this level that a new bull market began in October 1982. On August 25, 1983, with a roaring bull market underway and fueled by rumors of Brazil curtailing soybean sales, the Nov 1983 contract opened limit up at 967, 11 cents above the key 956 “End of cycle” price. It was the first time since the high nine years earlier that a November contract had regained that price. It did not hold limit that day; five days later it was at 882. In the ensuing weeks, it made two more attempts to break through 956, the final one on September 13, 1983. On that day it reached 968 (limit bid) but did not hold, closing out three cents above limit down, becoming a Gann key reversal day, and in fact, the high for the next two years. During the entire 1983 bull campaign, despite multiple attempts and a new historic price high, there were no closes at or above 956. The fifth mathematical “vibration” ruled once again, 33 years after the original low.
It was not until the 1988 drought soybean bull market, that the fifth vibration was finally taken out. The bull market ended when the Nov. 1988 contract hit 1046. just five cents below the midpoint in the sixth cycle, 1051. This article updates one I wrote in 1984 for a book by the Futures Symposium International that ended by saying. “When a November soybean contract finally closes above 956, you will have before you the next two important resistance price levels, 1051 .6 (1/2 of the sixth cycle) and 1147.2 (the end of the sixth cycle.)” So it was not surprising when three years later, Gann’s “Vibration Table” once again brought in the final high price with its invisible resistance and support levels, in the current market, you may find the contract low of the year in “End three Cycles of the Low” for the Nov. 1989 contract. When the next bull market rages in soybeans, you too will have this before you. Remember that it’s perpetual; it can be used year after year for November contracts. If prices in future years move beyond “seven cycles of the low,” just add 191.2 to continue the Table into ever higher levels.
Advanced Books and Courses on W.D. Gann Methods


THE DOW VIBRATION TABLE
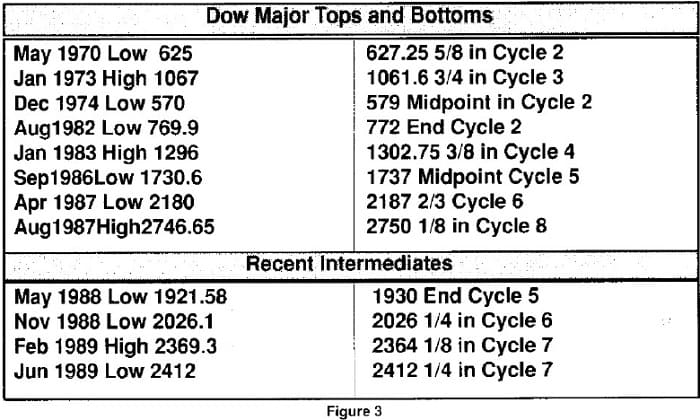
This Table is a variation on “cycles of the low” as it is based not on a historic low but on the 1929 high in the Dow Jones Industrial Average, ~ It was the high of a 60 year cycle so it’s importance mathematically is obvious. It’s divided into eighths and thirds beginning at “0’ and added to itself in exactly the same manner as the Nov. soybean low. When this Table was presented in the 1984 article, it had only “four cycles of the High.” As you see in figure 2, the natural course of prices required extension of the Vibration Table to the current “eight cycles of the High.” Cycles five, six, & seven have proven their value many times since their addition. Space doesn’t permit a complete review of the last 30 years of Dow Tops and bottoms, but there are several that should be noted here. High and low prices are “calculated” intraday, by Dow Jones reference material, not “print” or closes. (see figure 3).
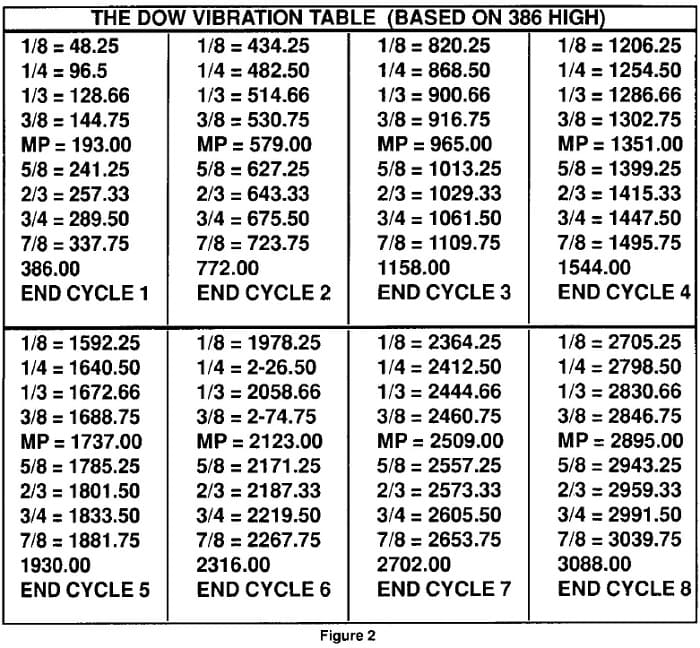
Notice that the intraday high August 25, 1987, did go through the “End of Cycle 7 2702” but did not stay above it as 2702 is Gann’s “Death Zone” number of 7 x 386. At the time it occurred, it was ‘natural” resistance, calling for at least a sharp correction. What followed was certainly that. Until proven otherwise, it’s been the terminal high for the Dow of the 13 year bull market that began in 1974. The markets have taught me not to expect perfection (not even from the Gann methods) but it would be perfect if the Dow 1989 final high came in on September third at 2702. Then, the 60-year cycle high would be exactly seven times the 1929 high on the same date.
The Vibration Table for the Dow has been outstanding over the years for both intermediate and final Dow prices. So there is no reason to believe that its effect will diminish in the future. As with the soybean Table, it’s perpetual, so if “eight Cycles of the High” should prove to be insufficient in future years, just add on to it, knowing that 10, 12 and 16 cycles are also very strong natural” invisible Gann resistance levels.