Trading Articles
Planetary Harmonics and Market Reversals: A Timing Analysis
The question of whether the positions and geometries of the planets of our solar system affect market action has been a long and hotly debated issue. In recent years, I have been perfecting a method by which I believe to have put the question to rest. The concept is simple, and started with the research of my mother, Jeanne Long, who in turn was following up on the research of W.D. Gann. My methodology involves a constant survey of price vs. harmonic positions of the planets in the system. I do this simply by converting planetary positions into price, and noting the points in price where planetary geometries occur. As these geometries approach, the plotted positions of the planets involved approach one another in price (plotted in line format), thus creating an energetic price level.
Oftentimes, a market will approach the position of the planetary geometry and respond to that price level with precision, creating a reversal. As I have become more and more familiar with the price patterns associated with market reactions to planetary harmonics, I have learned that the market is in a constant state of action and reaction to these price levels as they form and dissipate. The patterns can be related to those found in fractal geometry, which resembles a random walk until closely inspected.
Indeed, the market is constantly expanding and contracting within the confines of the price-energy created by the planets, and this occurs on all time frames simultaneously, from a one-minute to a yearly basis.
In order to understand the concept of planetary harmonics, one must first understand the basic concept of the conversion of planetary position to price. This is a simple concept, and when plotted in price creates a system of “planetary lines”. All examples in this article were generated by the Quick Harmonic Trader software.
PLANETARY LINES:
Planetary Lines is the term we use to describe the method we use to convert planetary energy into price. A planetary line is basically the position of a planet (in longitude) converted into price. The conversion is really quite simple. If a planet, for example, is at a longitude of 187 degrees on the wheel of 360 degrees (using 0 degrees Aries as the starting point), that would be equal to 1.87, 18.7, 187, 1870, 18700, etc., depending on the price of the market you are looking at. For stocks trading in the 10- 100 dollar range, I assign a conversion value of 1 degree = .10 dollars, or 10 cents. For stocks trading above $100, I switch to a conversion value of 1 degree = $1.00. For a market trading in the 1000’s, the value would switch to 1 degree = 10.00.
Advanced Books and Courses on Astro Trading & Esoteric Methods


Sometimes, a stock may be oscillating back and forth across 100 dollars, or an index oscillating across the 1000, or even 10000 level. When this occurs, I use the latest closing price to define the conversion value. In actuality, there is a condition I refer to as a “beta-shift” that occurs around these levels, where price will temporarily respond to the conversion factors of the two different calculations, and it is usually not until the price moves above the 150-180 area (or 1.50-1.80, 1500-1800, 15000-18000 etc.) that price begins to respond specifically to the new conversion value. This is a more advanced concept, and we will not dwell on it here.
For my analysis, I use only the geocentric positions of the planets (geocentric means as viewed from the Earth). I use the positions of all of the planets, and the Sun, and also the position of the Moon’s Node (the point where the Moon crosses the plane of the ecliptic). I use the position on the Moon’s Node simply because it is a very powerful point in space, and we do indeed find many major reversal which are associated with aspects of the planets to the position of the Moon’s Node, one of which will be used as an example in this article.
Chart 1 shows the positions of Mars and the Moon’s Node plotted in price, overlayed on the price chart for Teredyne, during the period of June-November of 1998. You will immediately note the point where the two lines crossed, at the low of the downtrend. This point is the graphic representation of a “conjunction” between Mars and the Moon’s Node.
A conjunction occurs when two elements are located visually at the same point in the sky (i.e. the same longitude). We are all familiar with a Solar Eclipse, which occurs when the Moon and the Sun are in conjunction, and have the same declination (declination is latitude position, or distance above or below the plane of the ecliptic). In short, a conjunction between two planets, or a planet and the Moon’s Node, is the most powerful geometric relationship that can be produced. It can be said that conjunctions are responsible for a majority of major market reversals.
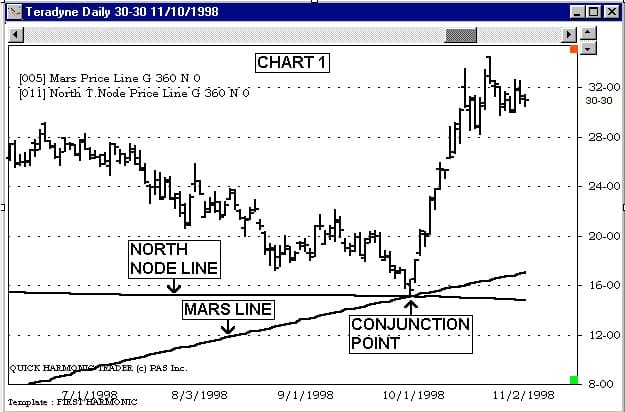
If we were to view the positions of the planets in a circular format for that day (October 8, 1998), we would have seen that Mars and the Moon’s Node were both in the same position, at approximately 150 degrees on the wheel (150.6 to be precise). For a stock such as Teradyne, who’s price range is between $10 and $100, the conversion factor is 1 degree = .10 dollars, so the position of the conjunction between Mars and the Moon’s Node can be easily calculated, 150 x .10 = 15.0. So, the critical price level on that day was $15.00, which was, in fact the exact low for Teradyne on that day. As you can see, this low marked the beginning of a very powerful rally, which is the pattern that I would have expected as a result of this precise correlation of price to planetary position. I bought Teradyne on the first technical confirmation of a reversing trend, using my favorite technical indicators, initiating a position on the open two days later.
You will notice that each line has its own particular angle, or speed. Mars has a much faster orbit than The Moon’s Node, and so its angle is greater. Each planet moves at it’s own speed, thus all lines have a different angle.
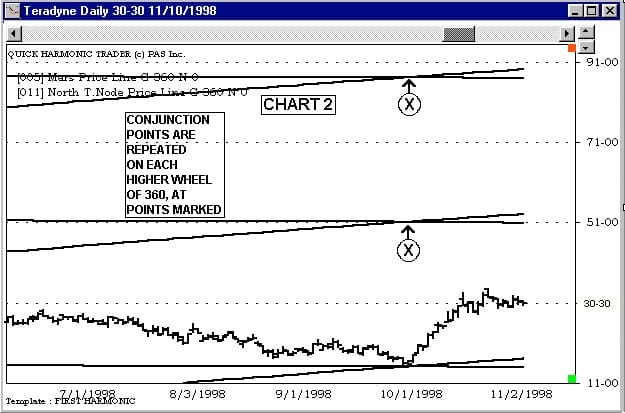
Now, you might ask, if the planet’s positions are plotted from 0 to 360 degrees, and 1 degree = 10 cents, then how can a planet’s position be plotted above $36.00? We simply add 360 degrees to the position to get to the higher levels. The next chart (Chart 2) will clarify this simply method. We have expanded the scale of the chart up to $95.00. You will notice now that there are three of each of the lines showing on the chart. The actual conjunction between Mars and The North Node occurred at 150 degrees on the wheel of 360. The lowest crossover point on this chart is at that point, or $15.00. The next higher crossover point is 360 degrees, or 36 dollars higher, at $51.00. The next is 36 dollars higher, at $87.00. This is just simple math. As an analogy, you might remember the chess board that Captain Kirk and Spock used in Star Trek. It had many transparent levels of play. This is much the same concept, the planets play on many different wheels simultaneously, each representing a higher multiple of 360.
It would be easier if all stocks and other markets traded constantly between 0 and 36 dollars, but they don’t, so we had to formulate this simple translation. Like many simple ideas, the proof is in the pudding, and in this case, the simple answer works. In this way, position can be translated to price at any level. Here’s another example. If we have an aspect that occurs at 187 degrees on the wheel, that would equal 18.70. You would find higher aspect points in price at 18.70 + 36.00 = 54.70, and the next at 18.70 + 36.00 + 36.00 = 90.70, and the next at 18.70 + 36.00 + 36.00 + 36.00 = 126.70.
The next convention that we need to explain is the concept of “Mirror Lines”. This is another concept that Jeanne and I discovered one day over coffee. We were musing about the fact that markets in uptrend usually follow the trajectory of a particular planetary line. But what about markets in downtrend. How could we define these trends when all planetary lines move upward? The answer, again, was simple. We simply inverted the positions of the planets across the 0 line to create downward moving lines. Here’s how it works:
If a planet is at 187 degrees on the wheel, it’s Mirror is at 360 – 187 = 173.
A planet at 98 degrees would have a mirror position of 360 – 98 = 262.
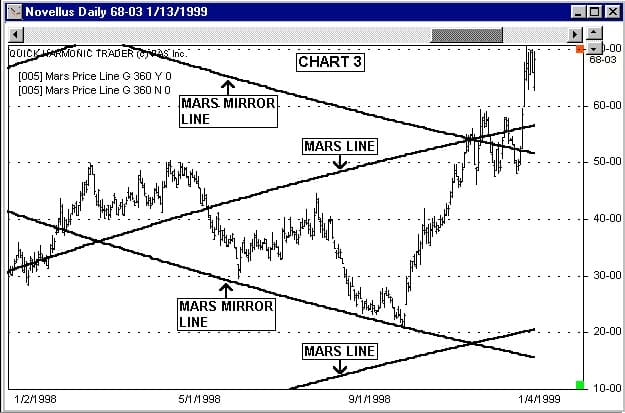
In this way, as a planet moves forward one degree of longitude, its mirror moves backward 1 degree, and the plotted line “mirrors” the actual plotted position of the planet. Let’s look at a chart of Novellus (Chart 3). We will add two Mars lines, one which plots its “regular” position, and the other which plots its “mirror” position. We will now see Mars lines travelling upward and downward. Notice how the downward moving Mars line defined the downtrend on this stock for many months. Now what is it that stopped that downtrend?
Again, we will add the planetary line for the Moon’s Node, and this time we will make it a mirror line. We will also remove the “regular” Mars line, so that we are now viewing the “mirror” position of the conjunction between Mars and the Moon’s Node. We can calculate the position of this mirror point by hand very simply. We know that the conjunction occurred at 150 degrees on the 360 wheel, so we simply invert this position, or subtract it from 360: 360 – 150 = 210. So, we know without viewing the chart that the mirror position of the Mars-Node conjunction was at 210, or $21.00.
Our next example chart (Chart 4) shows both the Mars and North T. Node Price Lines at the mirror settings. Note that this stock reversed on the same date, October 8, 1998, at the point where these mirror lines crossed, or $21.00. The low price on that day was exactly $21.00. I purchased Novellus and Teradyne on the same signal, from a reversal on the same planetary aspect.
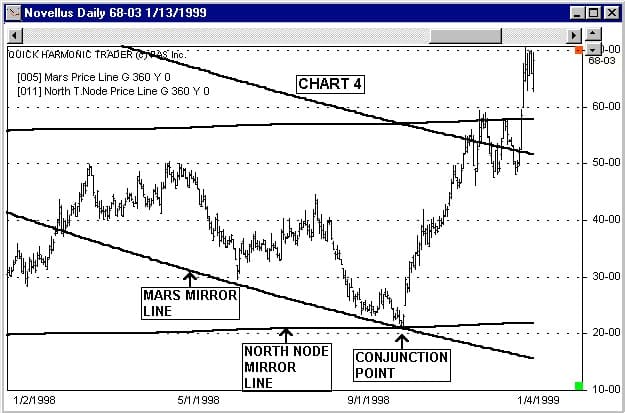
Now you can see how stocks and other markets which are trading at a wide variety of prices can all react to the same planetary energy at the same time.