Trading Articles
Treasury Bond Cycles and Elliott Wave Market Structure
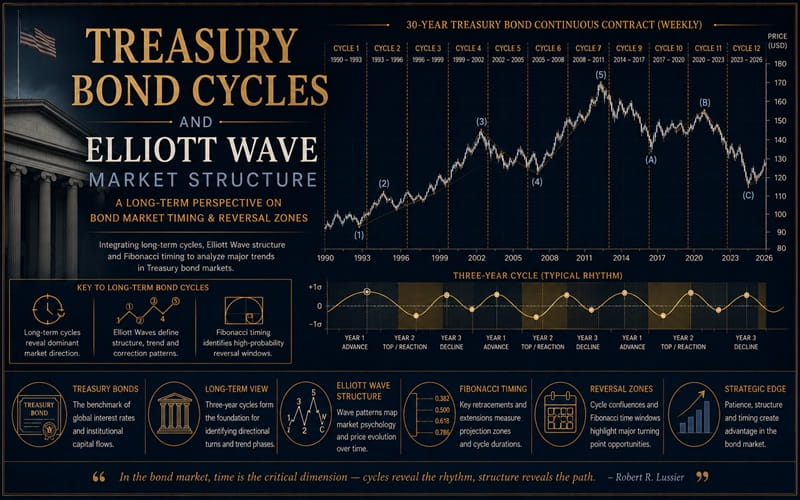
In today’s volatile markets, speculators naturally focus on very short-term market movements. However, they forget that what happens in the present is directly related to a bigger picture that deserves more attention. Such a situation now exists in the treasury bond market. It has apparently been next to impossible to decipher the intentions of the Fed and even more difficult to interpret the significance of the plethora of economic data which bombard the market day by day. Yet the technical picture, in terms of both patterns and cycles, is one that has exhibited exemplary clarity since the beginning of this decade. The cyclic profile has been exceptional at both extremes, i.e. tops and bottoms. Every three years, bonds have roughed and crested right on schedule because of two separate three-year cycles that have alternately punctuated both major highs and lows as regularly and accurately as the movement of a pendulum.
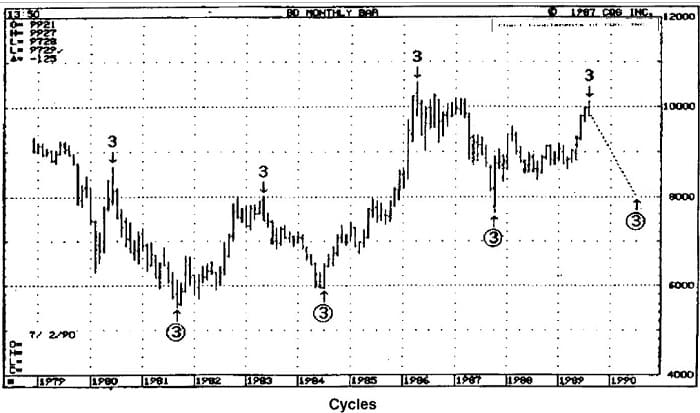
Cycles
I mentioned two separate three-year cycles since I believe that markets have to contend with two types of cyclic forces: cycle highs and cycle lows. These are separate entities that are in a constant tug-of-war; causing markets to demonstrate predictably exaggerated fluctuations from cycle low to cycle high and vice versa. Furthermore, these swings unfold following specific patterns that are reflective of human behavior and market moods as professed by Ralph Nelson Elliott over half a century ago.
In the present case, it is obvious that the three-year cycle high has delivered every important top starting with the peak in 1980 and working just as effectively in 1983, 1986 and more recently again, in the first week of August 1989, as I have been expecting. Corroborating this phenomenon, every three-year cycle low (1981-84-87) kicked off a rally lasting exactly 21 (Fibonacci) months on average. It has now been 21 months since the October 1987 low. I have found this kind of time symmetry to be a powerful and overwhelming argument in favor of a significant trend reversal as it has been in the past.
Elliott Waves
The Elliott Wave pattern has unfolded in great harmony with the cyclic outline just presented. The broad picture of the wave count can be best understood by referring to Elliott Wave Principle, by Frost and Prechter, (page 50. second paragraph): “As another application of the rule. if a large correction begins with a flat a-b-c construction for wave A, expect a zigzag a-b-c formation for wave B, and vice versa (see Figures 47 and 48).’ The application of this guideline is precisely how I view the wave count since 1979.
Wave A’ marks the end of a complex a-b-c irregular flat correction in June 1980 and is immediately alternated by a simple a-b-c zigzag ending wave ‘B’ in September 1981. Wave ~ as always, should contain five waves, of which only four have been completed thus far, with the final fifth well underway. Of course the market is not pressed for time, as we unfortunately seem to be much too often. This is why it’s always easier to resort to the fit-all, cure-all and much overused X’ wave. The ‘X’ wave is the perfect scapegoat label (hailed by many experts and neophytes alike) when a market takes a detour that does not seem to fit our sometime limited understanding of the message the market is conveying. If Elliott waves are not rendering a clear and simple explanation the analyst may end up forcing (‘X’ing) a wave count to an extent that substitutes hope for reality. In such a case, it is best to put time on your side and let the market clear up. You’ll find this approach less frustrating and most of all, less costly.
Advanced Books and Courses on Market Cycles & Timings


The current market pattern is further clarified by referring again to Elliott Wave Principle (page 23): “4) The time frame does not change the pattern, as the market still holds to its basic form. Waves may be stretched or compressed, but the underlying pattern is constant.” This tenet well illustrates how it can be that bonds are still forging a protracted wave ‘C’ from their 1981 low. The underlying “five waves up” pattern has remained clear and constant since then.
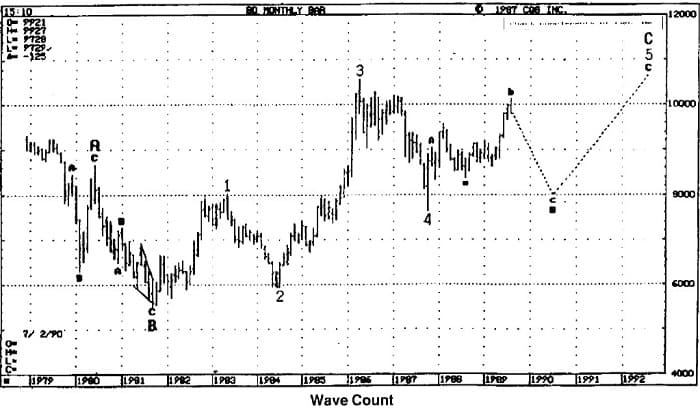
In case you may wonder about that overlap between waves four and one, it comes from the fact that wave one was a zigzag up’ as opposed to a ‘five waves up’ construction. This signaled the onset of a large diagonal triangle. This construction is the only five wave formation that trends like a normal impulse wave but where the bottom of wave four overlaps the top of wave one. I must admit that this case is made a little more difficult by the absence of the type of convergence which normally shapes the diagonal triangle pattern. A diverging diagonal triangle, albeit less common, is quite possible and has been noted in a few other instances by the author. I don’t think that this detail of form divergence should take precedence over the larger cyclic clarity which corroborates the fact that the market continues to unfold according to my expected wave pattern.
Summary
In brief, bonds are at a major top now and should soon begin a decline that will set them back towards the 80 area, ideally by the third quarter of next year. They should then begin a rise that will bring them back above their 1986 high of 105 1/2 by the summer of 1992, thus fulfilling their wave count to neatly complete their very large irregular flat pattern 13 (Fibonacci) years from its inception in November 1979.
During’ his three-year association with Robert R. Prechter, Robert R. Lussier learned from the best how to balance the forces of cycles and Elliott waves as a chart keeper and market consultant. He saw how Prechter achieved many of the best calls that immortalized him as a market guru and made the diagnostic elegance of the Wave Principle available for the benefit of many market participants.