Trading Articles
Trading Ranges: Price Action, Failed Breakouts, and Pullbacks
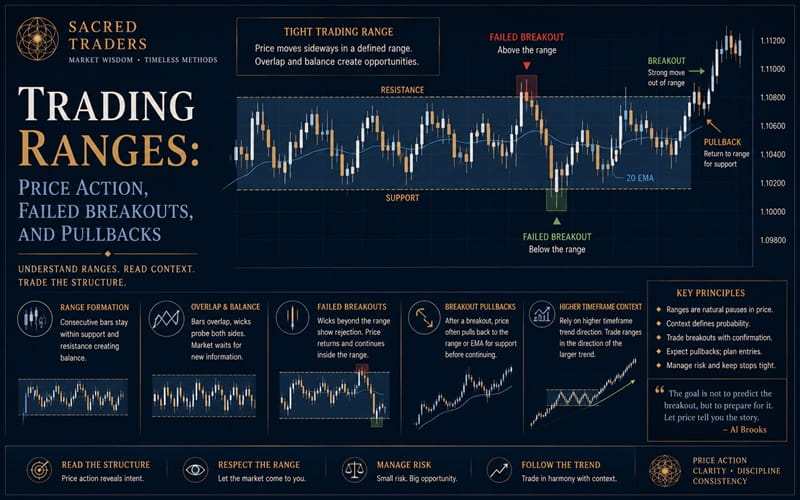
If the chart is composed of upswings and downswings across the entire screen, then neither the bulls nor the bears are dominant, and they are alternating control over the market. Each swing is a small trend that is potentially tradable, especially on a smaller time frame. If the sideways price action has lasted for about 5 to 20 bars, then a trader has to be particularly careful because the bulls and bears are in very tight balance. Trading breakouts in this situation can be costly since every brief up move is sold aggressively by the bears, and the new bulls are quick to exit. This results in a tail at the top of the bar. Likewise, every sharp move down is quickly reversed, creating a tail at the bottom of the bar. There are, however, ways to trade this type of market profitably.
In general, all trading ranges are continuation patterns, meaning that they more often than not break out in the direction of the trend that preceded them. They also tend to break out away from the EMA. If they are below the EMA, they usually break to the downside, and if they are above it, they tend to break out to the upside. This is especially true if the trading range is adjacent to the EMA. If they are far from the EMA, they may be setting up a test back to the EMA. If a bull swing pauses in a trading range, the odds favor the ultimate breakout taking place to the upside. However, there may be several failed breakouts of the top and bottom before the final breakout, and sometimes the market breaks out Countertrend. Also, the longer a trading range continues, the greater are the odds that it will become a reversal pattern (accumulation in a bear trading range, distribution in a bull trading range). Because of these uncertainties, traders need to be careful and look for risk price action setups. Trading ranges on a 5-minute chart that last for hours with many big, hard-to-read swings can be small, clean, and easy to read trading ranges on a 15- or 60-minute chart, so it sometimes is helpful to look at higher time frames.
TIGHT TRADING RANGES
Tight Trading Range is a common pattern that has been called many different things, but none of the terms is adequately descriptive. It is any sideways movement of two or more bars with lots of overlap in the bars. The bulls and bears are in balance, and traders are waiting for a breakout and the market’s reaction after the breakout. Will the pullback reverse through the opposite side or just test the breakout and then continue? When a Tight Trading Range slopes slightly up or down, it is still a Tight Trading Range, and it should be treated the same way. The bulls and bears are in close balance, and in general it is best to wait for failed breakouts and Breakout Pullbacks. In general, they are continuation patterns, like the small one that ended at Bar l .
The range that started at Bar 2 in Figure 5. 1 was after two sharp bear legs and should be expected to be protracted and likely to lead to two up legs (the move to Bar 3 became the first of the two legs). These patterns are difficult to trade and often have false breakouts. It is wise to trade them minimally if at all, and simply wait for the inevitable clarity that will reappear.
A Tight Trading Range is usually a continuation pattern, but after a climax (usually a trend channel overshoot and reversal), even a small one, the market can break out in either direction. This is because the climax has generated momentum in the opposite direction and you will not know whether this opposite momentum will be continued and lead to a breakout, or if the momentum of the prior trend will be continued.
Horizontal flags and Barb Wire are small forms of Tight Trading Ranges and, like most Tight Trading Ranges, usually break out in the direction of the prior trend. Sometimes the pattern can extend to 20 or more bars with tiny tails, and it then truly becomes a setup with no predictive value. Since guessing is never a sensible approach to trading, price action traders have to wait for the breakout before deciding what to do. In the majority of cases, there is a failure within a bar or two of the breakout, and the odds of a profitable trade are higher if you base your entry on the failure rather than on the breakout. In most cases, the failure fails and becomes a Breakout Pullback. Enter in the direction of the breakout on a stop once the bar after the pullback takes out the extreme of the Pullback Bar. In a bull breakout, you would enter on a buy stop at one tick above the Pullback Bar. If the Pullback Bar instead plunges through the opposite side of the Tight Trading Range or if it does so in one of the next couple of bars, you enter short on a stop at one tick below the Tight Trading.
Because the move after the breakout is often not strong, the market remains largely trendless for the rest of the day, resulting in this frequently being not a particularly profitable trading pattern. The pattern is more reliable with stocks, and it occurs frequently and sometimes results in an extended trend, so it is worth understanding. It often has other types of setups (small trendline breaks, HighILow 2s, and so on) within it, and those are often tradable and have a much higher chance of resulting in a profitable trade than a Tight Trading Range breakout. Only enter if the setup bar is a small bar near the top or bottom of the range, and only fade the move (for instance, sell below the low of a small bar near the top of the trading range). In fact, it is usually better to focus on them than to wait for the breakout.
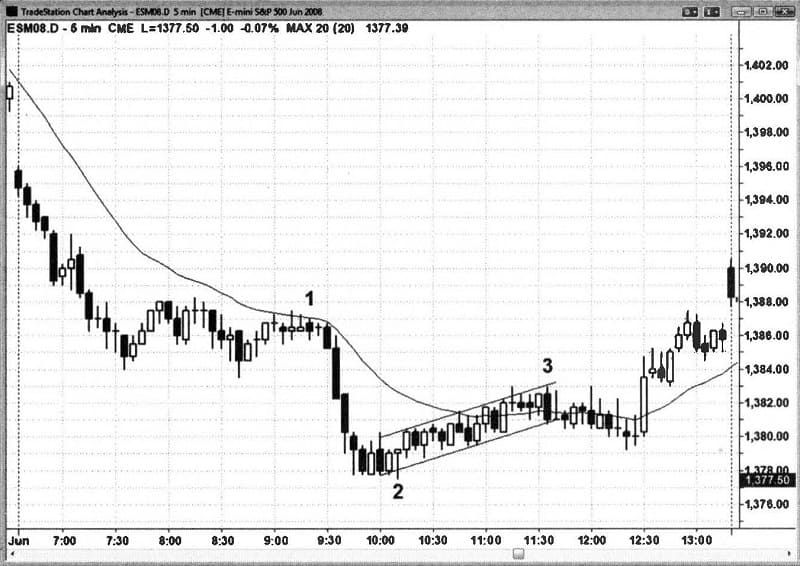
By Bar 4 in Figure 5.2, it was clear that the market had entered a Tight Trading Range. Both Bars 5 and 6 failed to break out of the top, and the Tight Trading Range evolved into a triangle, which is also usually a With Trend pattern. Since the last trend was up from the low of the day, an upside breakout was likely, especially since all of the bars are holding above the EMA. After two failed breakouts, the odds were much higher that a third breakout would succeed. Also, Bar 7 was a High 2 pullback from the Bar 5 high, which had some momentum. An aggressive trader would have bought the High 2. The next logical buy is a breakout above the high of Bar 5, the first failed breakout. You could also buy at one or two cents above the high of the day. The highest probability entry was the First Pullback at Bar 9, which reversed up after taking out the bear reversal bar’s low by only one tick, trapping shorts. Another high-probability buy is the M2B at Bar 10. Both of these high-probability trades resulted in smaller gains but with a much higher chance of success.

LEH formed a Tight Trading Range starting at Bar 6 in Figure 5.3, which could be part of a two-legged pullback forming a Higher Low in a new bull. The bear trendline is broken, and the market has held up for a long time (about 30 bars). You could enter on a stop at the breakout of any prior swing high, such as Bars 7, 5, or 4. Bar 3 reversed up from yesterday’s low, and it was the third push down on the day, which often leads to a rally.
Advanced Books and Courses on Price Action Trading


The sideways move went well past the bear trendline, indicating that the bears had given up to the point that they were in balance with the bulls. Bar 6 formed a Higher Low after the trendline break. The odds were high that there would be a rally that would extend to at least the top of Bar 2, the first bull signal bar in the bear leg. The First Pullback after the breakout was the small bull inside bar at Bar 9, so buying at one tick above its high was a high-probability long.
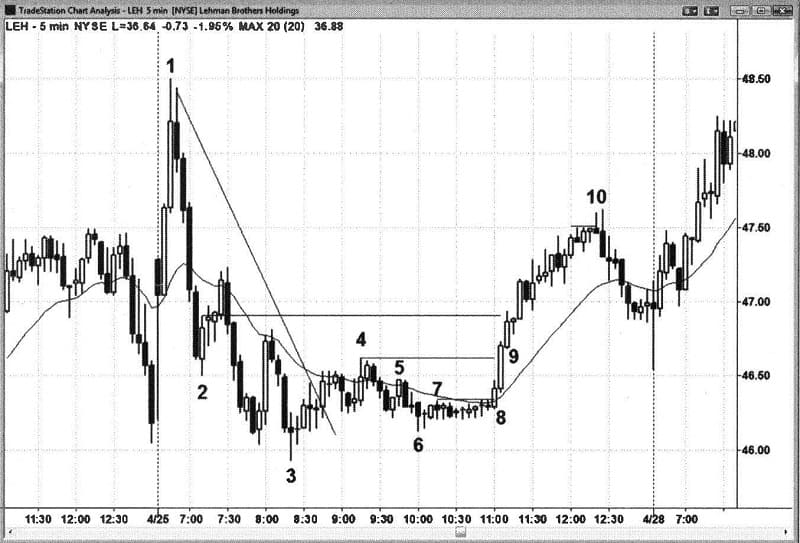
Bar 10 was a false breakout of a small flag that was also a three bar Tight Trading Range and about a 65 percent retracement of the bear down from Bar 1. The 65 percent is significant only because it means that the rally had retraced a lot of the selloff from the Bar 1 high, and if the rally extended much further, the market would likely be in a new bull phase. Fibonacci traders would call the rally to Bar 10 a 61.8 percent pullback and say that it was close enough, but every pullback is “close enough” to some Fibonacci number, making the Fibonacci numbers essentially meaningless most of the time.
By Bar 3 in Figure 5.4, Barb Wire was present because of three sideways bars with at least one being a doji. This means that you should only look to fade failed trend bar breakouts or small bars near the top or bottom. Bar 6 was a bear trend bar breakout followed by an ii setup that led to a long scalp.

Bar 7 was a failed bull trend bar breakout following the first failed breakout to the downside, and Failed Failures are second entries and therefore especially reliable. The short after Bar 7 is also a small Expanding Triangle (as was Bar 5, but it was too tight to expect much movement), which is a good reversal pattern.
- Part of book: Reading Price Charts Bar by Bar By Al Brooks