Trading Articles
Trading Channels By Chaitali Mohile

When the market turns volatile, traders are forced to hunt for new trading strategies. Channel trading is one method to turn to. A wise trader will continuously analyze new trading strategies in different market situations. The year 2008 began on a depressing note and the global economy entered a recessionary period as the market corrections hit lower lows in 2008. It was a challenging time for traders. By the time the nature of the market correction was recognized, many market participants had lost 50% of their gains and were on the verge of withdrawing altogether from the trading business. This is why it is essential to identify a correct trading strategy so you don’t find yourself in such a situation.
What Time Frame is Best?
In volatile markets, you cannot rely on one particular technical aspect. You need to thoroughly test a combination of technical tools. Channel trading could be one of the good strategies during the uncertainty in the financial markets. But if this strategy were combined with candlestick patterns, reliable momentum indicators, breakouts, and so on, you could make handsome profits. Channels can move upward, down-ward, or horizontally (flat), so the first step is to identify the type of channel being formed. To do this, three pivots that usually appear in early trading hours must be marked.
Channel trading is more suitable for intraday or very short-term trading so you can apply them on hourly or daily charts. If you apply channels on weekly charts, trades will be triggered once every two or three months and the risk associated with these trades is very high. However, if you are going to use channels on intraday charts, keep in mind that using a time frame shorter than 30 minutes will be very choppy.
Ascending Channel
A channel that is moving upward is referred to as an ascending channel. In this channel, there must be two higher low pivots and a corresponding high pivot. The original line for the channel is drawn by joining the lower pivots. Then a parallel line is made touching the top. The second line drawn in an ascending or descending channel is referred to as a return line. The rising channel is a short-term bullish rally in a downtrend or a continuous pattern in an existing uptrend. If the channel is formed on an intraday chart, a buying opportunity appears near the lower trendline. The stock will continue channeling upward till it breaks the upper trendline.
If you are using channels for intraday trading, the breakout should be a profit-booking point. Even though you may know the direction of the breakout, the intraday trade cannot continue into the next trading session. Discipline is a necessary ingredient for successful trading. An ascending or descending channel would fail if the price penetrates either of the two parallel lines during the trading session. In such an event, you should immediately close your positions and wait for the next opportunity.
Trading within the channel is a good strategy for short-term or long-term trading. The daily time frame would generate the trade faster than that of the weekly or monthly time frame. You may initiate a long position when price touches the original line, with the target being when the price touches the return line, which in the case of an ascending trendline would be the upper trendline. To protect the trade from whip-sawing, you can place your stop-loss a few points lower than the support line. The price action is restricted within the two parallel lines of the channel. When the price moves in the rising channel for a longer time, say for two or three months, the short-term trend is likely to be bullish.
Another trading system could be buying on the upward breakout or short-selling on a bearish breakout of the channel. These breakouts are likely to be a trend continuation since a breakout of the trend-lines would generate a robust rally. Those already long from the lower trendline can either add their current positions or continue the trade with the new stop-loss near the freshly formed support line, which is the return line. Due to the breakout, the developing uptrend is likely to turn stronger.
The conditions would be reversed in case of a downside breakout in the existing up-trend. Traders can initiate short positions since a fresh bearish trend is developed. The stop-loss for this trade could be placed near the lower trendline. Whatever the channel type is, the stop-loss should not be placed exactly on the upper or lower trendline. This would safe-guard the trade from volatile price movements.
Suggested Books and Courses About Trend Trading


On the hourly chart of the S&P Large Cap Index ($Spx) in Figure 1, the index made two higher lows (A and C) and a high pivot (B). The lower trendline is drawn joining A and C, and a parallel line is drawn through B. This is the return line. The construction of these two parallel lines creates an ascending channel. After identifying these three pivot points and the upward channel, you can decide where to enter and exit your trades. Your first entry would be at point C with the upper trendline as your target. Since Figure 1 is an hourly chart, you can remain long or short till either trendline is challenged. From that chart, you can see that the $Spx reached an upper trendline within two trading days. You can place a stop-loss for your entry just a few points below the lower trendline.
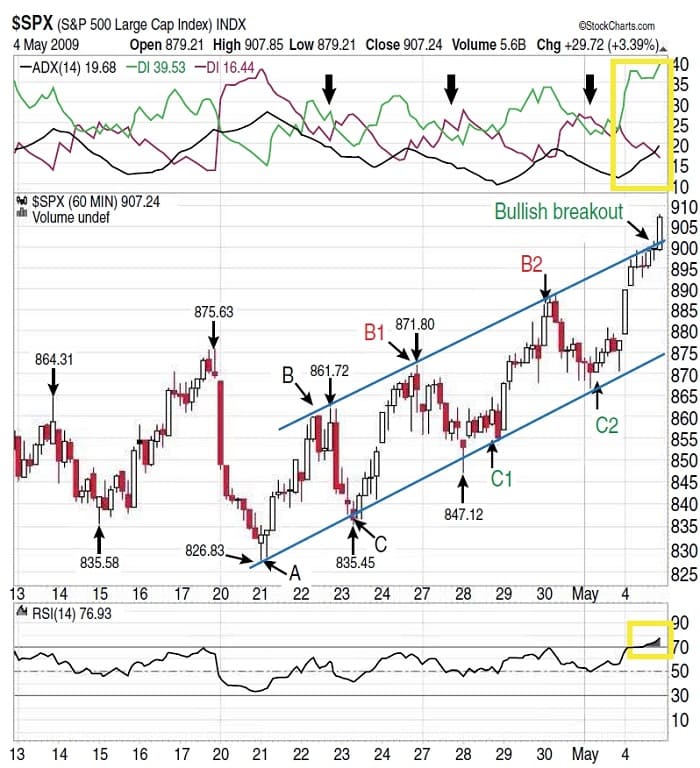
Channel trading will protect your trade in an uncertain market since you know your entry and exit points. The trading range in Figure 1 is relatively wide so it is a good example to illustrate how to apply the channel to your trading. As I mentioned earlier, you can go short or long when trading channels. Note that there are three buying points (C, C1, and C2) and two selling points (B1 and B2).
It may appear very straightforward, but it’s always a good idea to combine channels with some indicators. Note in Figure 1, I have included the 14-period relative strength index (RSi)(14) and the average directional movement index (Adx)(14). The RSi(14) was moving sideways during the bullish rally, while the trend indicator Adx(14) was declining with equal buying and selling pressure. The positive directional index (+DI) and negative directional index (-DI) are tangled, indicating that a fight is going on between buyers and sellers. This conflict has increased the volatility in price action. The RSi(14) has sustained at the 50 level during the declines from the upper trendline, which suggests there is bullish strength in this market.
On May 4, 2009, the $Spx breached the upper trendline, indicating a bullish breakout; those who entered a long position at C2 have a reason to rejoice. The RSi(14) has surged into the overbought zone, suggesting the possibility of a strong bullish rally ahead. And if the Adx(14) moves above the 20 level, it will further confirm the bullish rally. This reflects that the $Spx is likely to witness a significant breakout rally.
Once the index sustains above the newly formed support of an upper trendline, those who still have open positions can add to their positions and those waiting on the sidelines can open long positions with a stop-loss at 890. However, if the index moves parallel to the upper trendline and struggles to establish support, then the rally could weaken. Under this scenario, the index may even plunge to the lower trendline. So you should be highly alert in such a situation and place your stops.
Descending Channel
The downward moving channel is called a descending channel. The trading conditions and formation method of a descending channel are marginally different from the ascending channel. Here, the channel formation can be identified by drawing a trendline joining two lower high pivots and a parallel line at a low pivot. The upper descending trendline is the original line and the second line is the return line. For a valid descending channel, both lines should essentially run parallel to each other.
In Figure 2, the descending channel is drawn by connecting two lower highs at $53 and $51.41, and a parallel line at a low of $46.65. A and C marked on the hourly chart of Direxion Large-Cap Bear (Bgz) show lower highs, and B shows a low. The descending channel is a continuation of an existing downtrend, and if it appears in an uptrend, the falling channel would be a short-term bearish formation. Buying and selling strategies in a descending channel are the converse of those in an ascending triangle. They are ideal for short entries in that you can use the upper trendline as your entry points and the return line as points to cover your position.
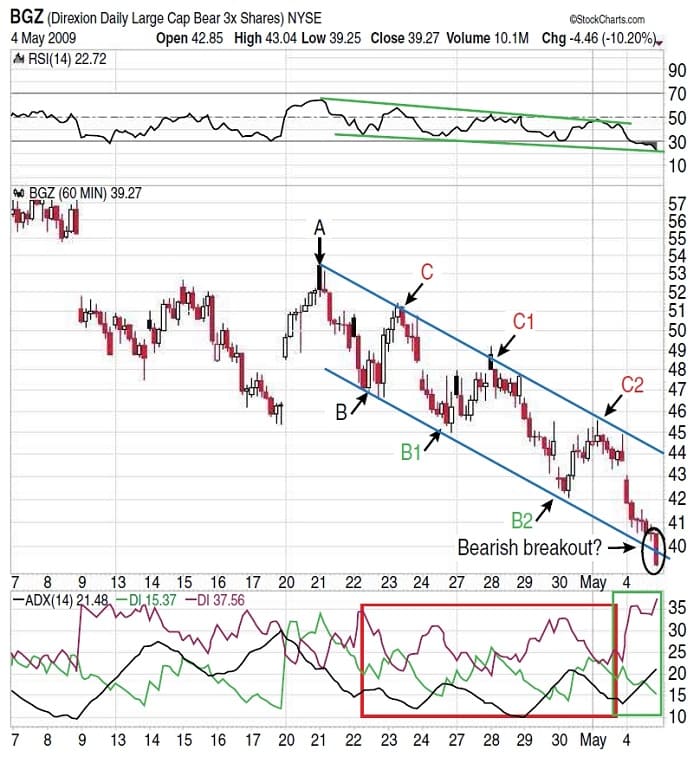
From Figure 2, you can see that traders can initiate short positions at three points, C, C1, and C2, and book profits at B1 and B2, respectively. If you opened a short position at C2, you could make a very significant profit since the price broke below the return line.
Adding Indicators
It is always advisable to use more than one oscillator for additional confirmation on the trade, particularly in a choppy market. To analyze the market momentum and the trend, the RSi(14) and Adx(14) are used as filters. In Figure 2, the RSi(14) is declining, forming lower highs and lower lows. This signifies bearish strength and more downside for Bgz. The RSi(14) movement can be considered at every individual trade within the channel. The Adx(14) indicated extremely choppy market conditions. Although the trend is weak, the high selling pressure has suppressed the buyer’s side.
Trading within the channel is a good strategy for short-term or long-term trading.
The stock has bounced in an opposite direction each time it hit the upper or lower trendline. The price has hardly moved parallel to the trendlines on either side, but the price action on May 4 and 5 is different than earlier moves. In early trading hours, Bgz flirted with the lower trendline, indicating a breakout. Therefore, we can anticipate a bearish breakout for Bgz. The Adx(14) surged to 25 levels, suggesting a developing downtrend, and the RSi(14) at 30 is indicating a bearish rally. If this breakout occurs in the next few sessions, those traders who are short at C2 could continue holding their trade, but you can also open new short positions at this breakout level. The breakout would be a continuation of the current downtrend. But the stock could bounce back, so it’s a good idea to place a stop-loss just above this return line and keep an eye on the other indicators for confirmation signals.
Horizontal Channel
The horizontal channel appears during a sideways price action of the stock. The channel resembles a rectangular pattern. While consolidating, the stock moves in a range and forms various highs and lows. The horizontal channel is considered to be a continuation pattern in an uptrend as well as in a downtrend. The upper trendline formed by joining the highs is the resistance, whereas the lower trendline connecting the lows is the support level for the stock or index. The horizontal channel is formed due to flat price action; therefore, the channel is not tilted either upward or downward. Trading within the channel offers good support-resistance lines. Buy signals appear near the support line, which is the lower trendline, and sell signals near the upper resistance line. Bullish and bearish breakouts could be considered to be areas to initiate new positions or close existing ones.
Horizontal channels tend to be very common, since consolidations usually follow a rally. Traders often tend to stay away from consolidating markets, but if the trading range is large, they present low-risk entry and exit opportunities. Unlike ascending or descending channels, horizontal channels can be applied to longer time frames such as weekly or monthly charts.
Chaitali Mohile is an active trader in the Indian stock market.