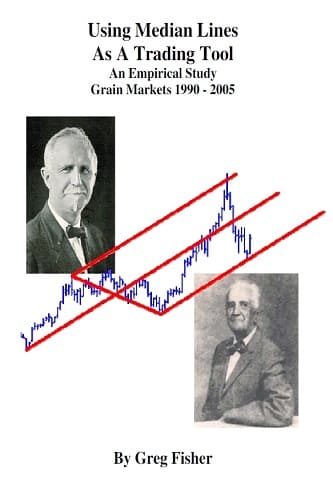
Using Median Lines As A Trading Tool: An Emipirical Study Grain Markets 1990 – 2005
$15.81
The Median Line method is a trendline technical analysis tool used by chartists to gage market movement. The Median Line method was developed by Dr. Alan H. Andrews to determine potential market direction by drawing a single line on the chart of any market security. Dr. Andrews study of the method determined price action returned to the Median Line 80% of the time. Obviously, having the ability to gage market price movement and being 80% accurate would be of interest to a number of people. To determine the effectiveness of the Median Line method and if the 80% accuracy holds true.
Introduction:
Technical analysis of the exchange-traded markets is a method applied by investors to predict future price movement based on past price history. Technical traders rely on indicators including statistical indicators, price patterns, and trendline analysis. Today’s computers have made a variety of indicators accessible to traders, including indicators that are based on price action and on time series. Stochastics, Bollinger Bands, Relative Strength Index, and Moving Average Convergence Divergence are a few of the commonly used indicators.
The indicators are designed to give the trader an idea of where prices could be headed and when a trend will end or begin based on price history. Today, many traders watch live data streamed to their computer and evaluate market action as it unfolds. Traders in the “pre-computer” era hand charted many commodities or securities often receiving charts in the mail only once a week. Traders would update the charts by filling in the price bars and using simple techniques such as trendlines to get a feel for the market. A trendline can be defined as:
“A trendline is an indication of levels of support and resistance in the market place. Price ranges and extremes in price action are smoothed in a way by using trendlines. In a fashion, trendlines help us to determine acceptable valuation levels during a certain time period. Longer term trendlines can indicate the various support or resistance levels of price that is mutually agreed through free market operations. As time and conditions change, so do the perceptions and evaluations of value, which leads to penetration of previously held valuation beliefs. Penetration of a long term trendline is an indication of changing supply and demand and could point to a trend reversal.”
With today’s technological advances, are the trendline techniques of the old days outdated and no longer useful? Have the markets advanced beyond the ability to use trendline analysis to gage market movement? One particular trendline tool was created by Dr. Alan H. Andrews. Andrews method called the Median Line, sometimes called “Andrews’ pitchfork”, was created to indicate lines of support or resistance where price trends tend to stall out or reverse. In essence, the Median Line is a method of channel identification in a trending market.
Contents:
- Introduction
- History of The Median Line
- The Median Line Technique
- Price Failures
- The Study
- Results
- Summary
- References
Using Median Lines As A Trading Tool: An Emipirical Study Grain Markets 1990 - 2005 By Greg Fisher pdf
| Author(s) | |
|---|---|
| Format | |
| Pages | 77 |
| Publication Year | 2005 |
Related products