Trading Articles
The U.S. Long Wave: Elliott Wave Analysis of Stock Market Cycles
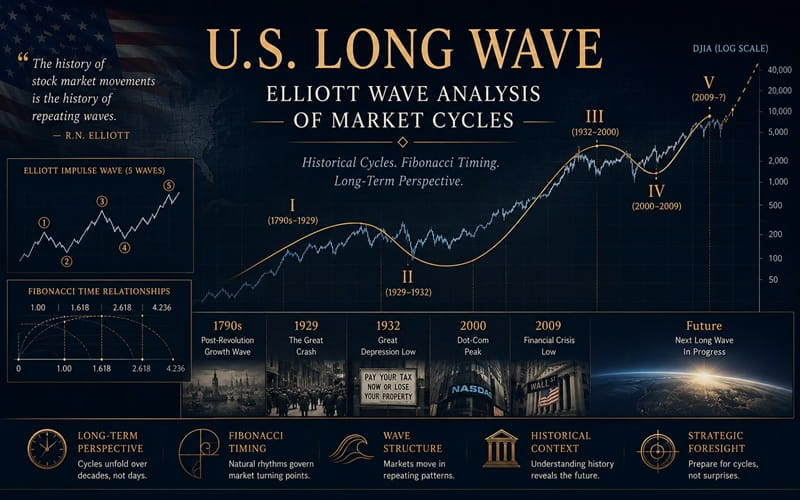
History plays an important role. Can 224 years of US economic history predict the stock market for the next seven years? Since the 1970s there have been many predictions of a coming economic collapse that would be larger than the Great Depression. We did experience a stock market crash in 1987 and some economic calamities in the early 2000s, but nothing approaching the degree of what happened in the 1930s. The answer to why a mega economic collapse hasn’t happened and most likely won’t happen can be discovered in the long-term US economic cycle.
The EBB & Flow
In 1934, Ralph Nelson Elliott made an intense study of stock prices and discovered a rhythmic pattern of waves. He called this phenomenon the wave principle, now known as Elliott wave theory. Elliott found that the pattern was not limited to just the stock market. He found the pattern in commodities, steel output, and patent applications. In addition, each five-wave pattern is a component of the next larger five-wave pattern.
In his first monograph titled The Wave Principle published in 1938, Elliott made an amazing proposal. Using the Axe-Houghton index, which had stock price data from 1854 to 1938, Elliott made the case that a decades-long five-wave pattern began in 1857 and completed with the major peak in the late 1920s. He labeled the peak wave (1) and the subsequent decline into the bottom made in 1932 as wave (2).
Later in 1946, Elliott wrote his second monograph titled Nature’s Law: The Secret Of The Universe. He used the year 1800 as the point of origin for the long wave and spliced US economic history to the Axe-Houghton Index. His new wave count had the 1850 economic peak as wave (1). The Axe-Houghton low in 1857 was labeled wave (2). The subsequent peak of the late 1920s was labeled wave (3).
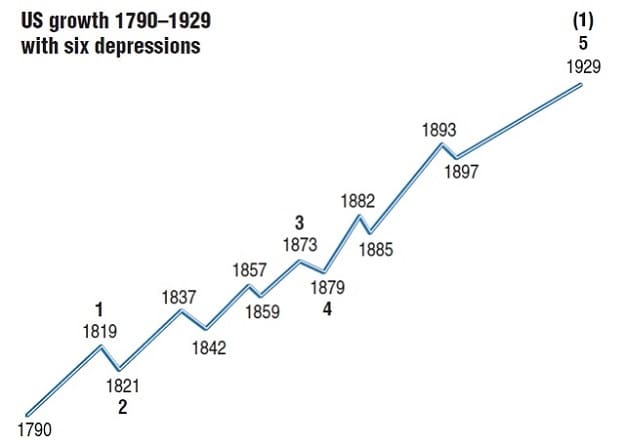
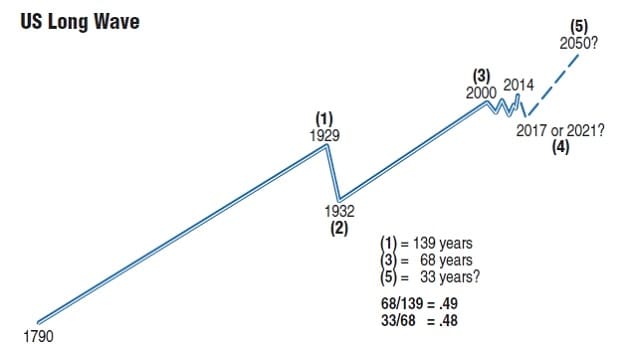
This count revision is partially responsible for the belief in a coming mega collapse. The post-1932 bull market was perceived as a fifth wave and, upon completion, could lead to the largest economic decline in US history. Elliott was correct to focus on economic history to determine the long wave count. He was incorrect in the subdivisions of the wave count for the 1800s. The economic history of the United States from 1790 through 1929 gives clues to the correct long wave count (Figure 1).
First Wave
- Determine the point of origin. The first full year of the existence of the United States under its current constitution was 1790. Prior to then, the states/colonies were in a loose confederation and sometimes competed against each other. So the year 1790 is the logical starting point to measure the economic and emotional progress of American society.
- Count the large economic declines from 1790 through 1929. Using two years as the minimum length for a large economic decline, there were six downturns that are recorded as either depressions or recessions. The dates are 1819–1821 (two years); 1837–1843 (six years); 1857–1859 (two years); 1873–1879 (five years and five months); 1882–1885 (three years); 1893–1897 (four years).
- Apply Fibonacci analysis to the data from the six economic downturns.
After Elliott discovered the wave theory, he realized it was linked to the Fibonacci sequence and ratios. The Fibonacci sequence is as follows: 1, 1, 2, 3, 5, 8, 13, 21, 34, 55, 89, 144, and so on. Some Fibonacci ratios are as follows: 1/1 = 1; 21/34 = 0.618; 13/34 = 0.382; and 8/34 = 0.236.
Elliott also discovered several Fibonacci time sequences that occurred between 1921 and 1942. Here are a few of them: the bull market from 1932–1937 (five years); the bear market from 1937–1942 (five years); and the bear market from September 1929–July 1932 (34 months).
Most of the downturns in the 1800s occurred in Fibonacci-number years. There is some dispute among historians as to the length of the 1837–1843 depression. Some evidence suggests the depression ended in 1842. If this were so, it would make it five years. Charting a rising wave from 1790–1929 with each of the six downturns results in an extended 13-wave Elliott pattern.
Additional evidence that 1929 was a wave (1) peak comes from the devastating 1929–1932 89% stock market decline. In 1990, Mark Thompson wrote an article for Technical Analysis of Stocks & commodities titled “An Overview In Elliott Terms” in which he argued that the 1929–1932 decline was too severe to be a fourth-wave decline. I agree. No other US stock market decline prior to 1932 was as large as 89%.
The economic downturn was called the Great Depression and it’s universally agreed that it was the largest economic catastrophe in US history. It lasted from 1929 to 1941. It was close to a Fibonacci 13 years and twice as long as the previous longest depression. These are characteristics of a wave 2 decline and not a wave 4.
An argument could be made that most of the time, third waves in the Elliott pattern are the longest and strongest, and therefore the third wave up should be the move from 1857–1929. But “most of the time” doesn’t mean all of the time. The growth of the United States between 1790 and 1929 was fantastic. The US went from being a poor country with a population clustered along the East Coast to one of the richest nations in the world spanning the continent. The population boomed, new industries formed, and the quality of life increased immensely. Even if, say, there were another whole new continent to develop, this still wouldn’t match what happened in the US from 1790–1929.
Using economic history, we can count five waves up from 1790–1929. It would be impossible for the US to have greater growth than what occurred over that period. Thus, the 1790–1929 growth period was a powerful kickoff for wave (1).
Advanced Books and Courses on Elliott Wave Theory


The Third wave
While the lack of reliable stock data in the 19th century makes accurate counting of the long wave difficult, we fortunately have plenty of dependable stock data for the 20th century. The move up from the major bottom made in 1932 to the peak made in 2000 was most definitely a five-wave Elliott wave pattern. In Robert Prechter Jr.’s book Beautiful Pictures published in 2003, he documents dozens of Fibonacci price & time relationships in the Dow Jones Industrial Average (DJIA) journey from the sorrowful depths of 1932 to the dizzying heights made in 2000. Prechter also dissected each subwave of the DJIA move from 1932–2000 and found multiple Fibonacci relationships within the subwaves and explained how they relate to each other. In addition to the Fibonacci relationships, the years 1999–2000 witnessed a period of intense manic stock speculation focused on the technology sector. At the tip of the speculation sword were the technology initial public offerings (IPOs). Some IPOs with no earnings and high debt could double in the first day of trading just because they had dotcom in their name. The speculative mania of 1999–2000 was the greatest since 1928–1929. Both manias were of the same degree, which indicates that both peaks were of the same degree in terms of wave count. The dual manias reinforce the already overwhelming evidence that the long US wave (1) peaked in 1929 and the long US wave (3) peaked in 2000.
The Fourth Wave
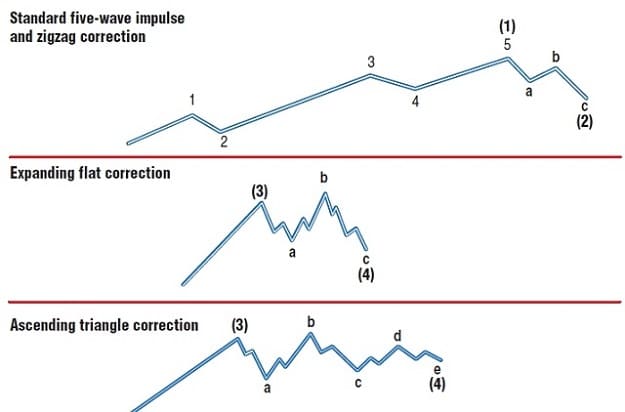
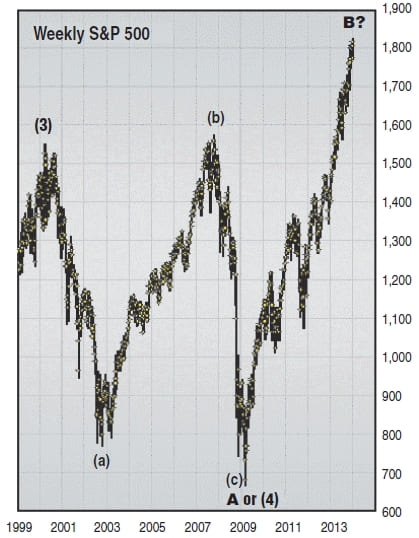
With that established, where are we currently in the long US wave? There are three families of corrective patterns: zigzag, flat, and triangle. Within each family are variations. In Figure 2 you see illustrations of variations from the flat family (expanding flat) and from the triangle family (ascending triangle). Examine the S&P 500 progress from 2000–2009 (Figure 3). The entire pattern is a textbook expanding flat. Could this mean that wave (4) of the long US wave is complete?
It’s possible, but if we examine the four market dimensions of price, time, sentiment, and momentum, it reveals powerful evidence that the US stock market may have reached a significant peak in late 2014, similar to the peaks of 2000 and 2007. Think of price and time as longitude and latitude, with sentiment and momentum as landmarks. While there is a lot of evidence in each market dimension that suggests a significant peak may have been reached, for the sake of brevity, I’ll focus here on the strongest evidence in each dimension.
The US stock market may have reached a significant peak in late 2014, similar to the peaks of 2000 and 2007.

Price dimension: The DJIA from October 2007 to March 2009 declined 7,728 points. Multiply this by the Fibonacci ratio of 1.5 and it yields 11,592 points. Add this to the March 2009 (DJIA) bottom at 6,470 and it results in a target of DJIA to 18,062. The December 26, 2014 DJIA high was 18,103, which is a difference of only 41 points, or two tenths of a percent.
Time dimension: The period from the DJIA top on January 14, 2000 to the bottom made on March 6, 2009 equals 3,340 calendar days. Multiplying this by the Fibonacci ratio of 0.618 yields 2,064 calendar days. Add this to the March 6, 2009 bottom, which results in a target of October 30, 2014. The DJIA high was on December 26, 2014—a difference of only 58 calendar days, or 1%.
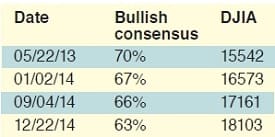
Sentiment dimension: The Market Vane Bullish Consensus indicates the stock market could be nearing a significant peak on readings above 65%. It usually takes one or more bearish sentiment divergences to occur before the peak is made. Here are some recent readings:
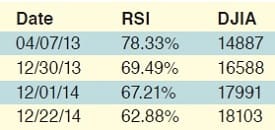
Momentum dimension: The RSI indicates the stock market could be nearing a significant peak on readings above 70%. Again, as with the bullish consensus, it usually takes on a bearish divergence before the peak is made. Here are some recent readings:
It’s rare for all four market dimensions to be indicating a peak. The last time it happened in the US stock market was in October 2007. If this is the case now, how long could the next bear market last?
Forecast
The Elliott wave guideline of alternation cautions the analyst to expect something different this time. The 2007–2009 bear market lasted only 17 months. The move up we’ve had since 2009 has been five years and nine months as I write this. It’s rare for a bear market to last five years. The best time candidate is three years, which is 0.618 of the five-year bull market.
The projected depth of the next bear market is governed by the two most likely Elliott wave patterns that have developed since the peak in 2000—an expanding flat or ascending triangle. Even though the S&P 500 and the DJIA have traded above their 2000 peaks, in Elliott wave terms they are both still in corrections (Figure 4).
A correction that can move above the impulse wave peak is usually bullish in regard to what can be expected in the next move down. The (DJIA) pattern from 2000–2009 is a perfect example of an Elliott wave correction moving above the impulse peak. The 2002 bottom was at 7,197, and the 2009 bottom was at 6,470, which was only 10% below the 2002 bottom. Thus, if wave C down of an expanding flat develops, 10% below 6,470 targets the level of 5,820.
If the ascending triangle forms, then wave C down will hold above the bottom at 6,470 and could conclude between 6,471 and the 2011 bottom of 10,404. Ascending triangles subdivide into five waves; if wave C bottoms three years from now, wave D up and wave E down would still need to form. The best time for the entire structure to complete would be 2021, which is 21 Fibonacci years after the peak in 2000.
Evidence indicates that long wave (3) peaked in 2000. The subsequent move to the 2009 bottom was shallow compared to 1929–1932. The US markets’ ability to continue moving above the 2000 top is an additional sign of underlying strength. While the DJIA going down to 5,820 would be bad, it won’t be a catastrophe greater than 1929–1932. If the US stock market does go into another bear market, be proactive and take advantage of events rather than have events take advantage of you.
- Mark Rivest is an independent investment advisor and trader.