Trading Articles
RSI Divergence Trading: Why Signals Fail in Strong Trends
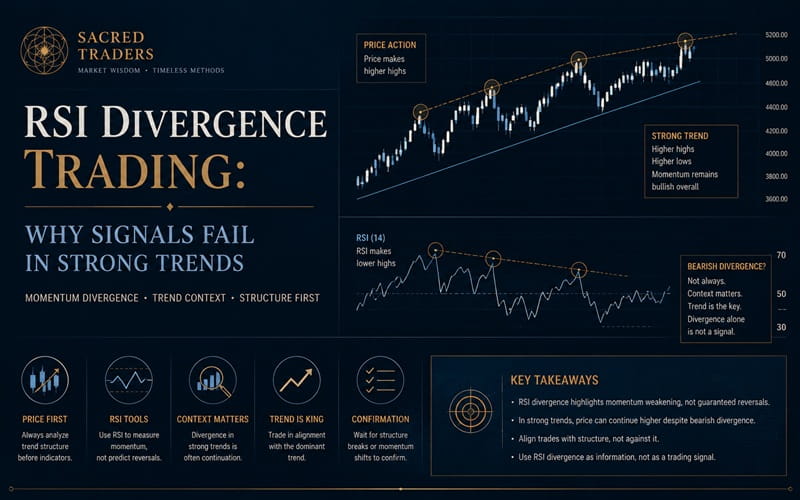
One of the first things that every trader learns early in his or her career is the concept of divergence. Whenever divergence is discussed, it seems that the majority of examples used to illustrate the concept use the Relative Strength Index. Divergence occurs in any momentum-based indicator and occurs when price and an indicator are doing different things, i.e., price is moving higher and the indicator is moving lower or vice versa. These types of divergence are classified as simple divergence. There are also examples of multiple long-term divergence and hidden divergence.
CHART # 13 – THE RISE OF INTEL – WHERE IS THE BULLISH DIVERGENCE?
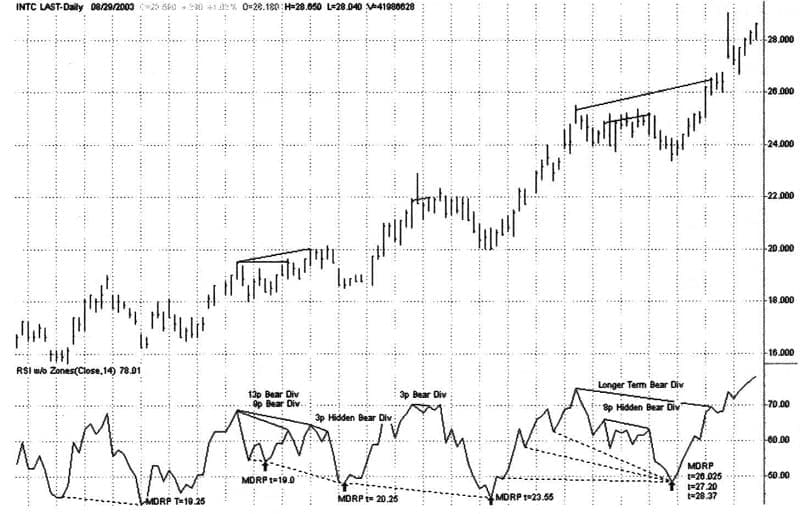
Chart # 13 Note: Don’t worry about what a MDRP is for now. Focus on finding the Bullish Divergence in this bullish chart. There are none! We shall see that they only occur in bear markets, not bull markets!
Let’s examine the concept behind a bullish divergence.
First. What is the price behavior doing just before a bullish divergence occurs on a chart? Price is declining. As more traders realize that the price is heading lower, they are attempting to get short or exit their longs by selling. The majority of these orders are “at the market,” and the floor brokers and traders continue to lower their offers to buy since the majority of the order flow is “at the market.” In other words, the sellers are hitting the buyers offer price causing the floor traders who are buying to continually lower their bid. Each time a new trade is executed the bid price drops.
Second. The RSI very accurately reflects the change in the average gain or loss for a time period. As prices continue to fall, they very often begin to accelerate lower. This acceleration is reflected in the RSI. The RSI value falls below 40, below 33.33, then below 30. At this point from our previous study of the ratios, we know that the ratio of average loss to average gain is badly extended. As the RSI moves lower, it is encountering increasing mathematical resistance. Remember that the RSI is a logarithmic line and for it to move lower when it is below the 30 level is much more difficult than when it was at 50.
Third. As prices continue to fall, one or two things will happen. The more perceptive traders in the existing timeframe realize that prices are becoming overextended. These are the traders who got short early in the decline. They begin buying to exit their positions and help to slow the plunge. As the plunge slows, the somewhat less perceptive traders also realize that prices are overextended and they also begin to exit, which typically stops the decline. Concurrently, traders in a longer time frame may have realized that prices are too low and step in with their buy orders. As soon as the plunge stops and prices begin to rally, even the dumb (but not proud) traders realize that the plunge is over and begin buying propelling prices higher.
Advanced Books and Courses on Technical Analysis


What was the cause for prices to accelerate downward in the first place? The answer to this question is simple; there were no buyers in the market. In order for the sell “at market” orders to be filled, someone had to be willing to buy. If there are many sell orders and no buyers, then prices can only go down. If there are no sell or buy orders entering the pit, prices will stagnate.
In any case, prices stop declining and begin to rally at some point. Just as an air bubble expands in size as it ascends in liquid, the RSI expands upward as it moves up from its extremely compressed state at the 30 or lower level. This is ordained because of its mathematical formula. As prices rally, there will be traders who begin to think that prices are “too” high and begin to sell; pushing prices lower thereby making new lows.
Because the RSI uses a ratio of average gain to average loss over “N” periods of time, it will be forced lower, but at a lesser rate than its previous rate of increase. Consequently, we will see a new low price, but the RSI value will not see a lower value than its previous low. This is a divergence between price and the RSI. At some point, the Bulls will overpower the Bears and the market will see another rally. Because the RSI value is so compressed, it will begin to increase its acceleration higher. As the RSI rises from levels below 30 towards 40, it begins to incrementally increase more than the price increases, giving the illusion of a new low.
The important question is, “Did the RSI rally above the 66.7 level or more generally the 60 level?” If not – the trend is still down. Let me ask you, “When does a bullish divergence make its appearance on the RSI chart?” The answer is only when prices have been declining. If divergence is considered within the context of trend, what is the existing trend when we see a bullish divergence? A downtrend! What can we use as an indication that the trend is down? We know we are in a downtrend when we see a bullish divergence. This is why in the above Intel chart there are no Bullish Divergences – the market is trending higher, NOT lower!
I realize that the published trading literature states that a bullish divergence is an indication that prices are about to rally. The “implication” is that a bullish divergence is an indication that an uptrend is about to commence. As you are now realizing, a bullish divergence only appears when the existing trend is down. If the trend is clearly down, why are we even thinking of buying? Wouldn’t it be more prudent to be looking for a place to get short?
A bullish divergence signifies that the existing trend is down and the Bears are exhausted. We should be expecting a rally to sell into. If we have short positions, then we should exit some or all of the shorts, but not reverse to become long! Prices should rally or reverse to some degree before falling to new lows. Inversely, when we see a bearish divergence, the trend is up and we should probably expect a retracement to lower prices because the Bulls are exhausted. It is time that we should begin looking for a reason to buy.
- A simple divergence means that prices have encountered enough resistance that they need time to consolidate their previous move. Once this has occurred. prices will resume their downward or upward march.
The price that generated the divergence often becomes a key number used to identify temporary support or resistance. Once this price is negated, it becomes a resistance or support point and can be used for a stop price.
CHART 14-DIVERGENCE PRICE BECOMING FUTURE RESISTANCE OR SUPPORT
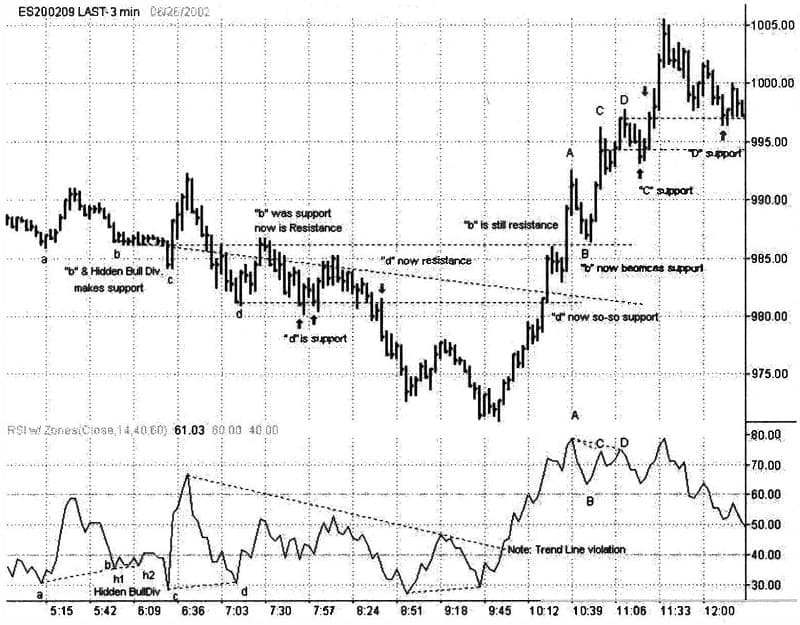
Chart 14 Notes: This chart contains 2 bullish divergence and one bearish divergence. The price where the divergence was made became future support/resistance. Remember that support once negated often becomes resistance and vice versa.
The strength of a divergence formation can be determined by observing the number of time bars that have elapsed between the RSI peaks and troughs that are creating the divergence. This is called Divergence Strength and is a method that is used to rank divergence as strong or weak. Generally, if the number of time intervals is less than 4, then there is strength in the divergence and an immediate retracement should occur. As the number of time intervals increases, the likelihood of a retracement decreases. In Chart # 14, from point C to point A there are 6 bars. This is called a 6 period Bearish Divergence and is not very potent. In the Intel Chart # 13 the interval is indicated by ‘N’p.
As the time interval between the RSI peaks and troughs increases, the likelihood of seeing multiple divergences also increases. Multiple bearish divergences occur when there are successively higher price rallies while the RSI has successive lower rally highs. Here is the paradox of divergences; simple divergence provides a strong indication that the preceding trend will resume as soon as the retracement is completed. But, multiple long-term divergences increase the likelihood that the preceding trend has ended. This concept is illustrated below in Chart # 15.
CHART # 15 – LONG-TERM MULTIPLE BULLISH DIVERGENCE
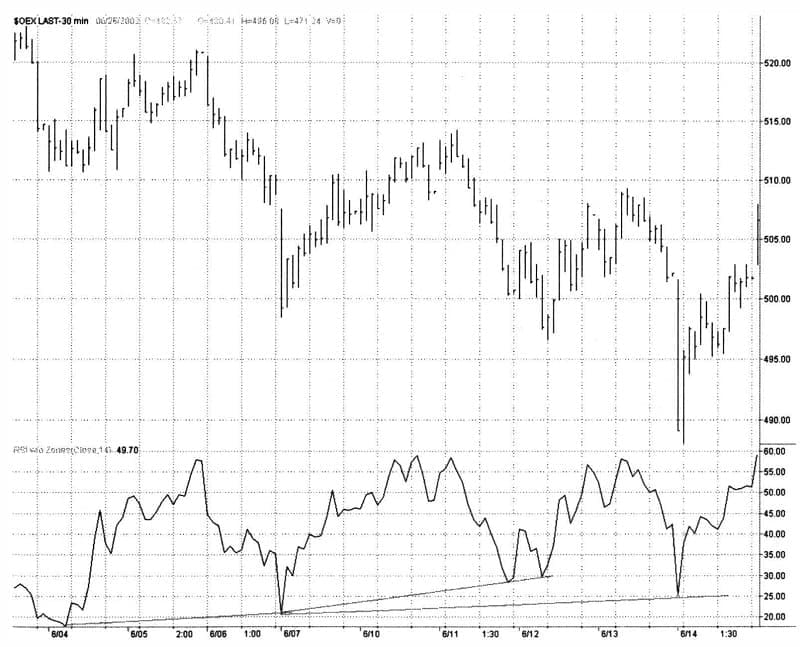
In Chart # 15, there are three bullish divergences where the price has made three consecutive lower lows while the RSI made three consecutive higher lows. These higher bullish divergences would be classified as multiple long-term bullish divergences. They are indicating that there is an increasing probability of a trend reversal occurring.
The most powerful divergence signals are called hidden divergences. They are called hidden divergences because they are not obvious to the untrained trader. These divergences do not occur at the bottom or top of the RSI chart like their more common cousins. They appear after the RSI has either rallied (bullish hidden divergence) or after the RSI has dropped from its high (bearish hidden divergence). Hidden divergence typically occurs in the 40 to 60 ranges. When hidden divergence occurs, it is classified as the strongest divergence possible. The market will do exactly as the name indicates. A hidden bullish divergence is a very strong indication that prices are about to strongly rally. Put another way, a hidden bullish divergence that appears in a bear market is a strong indication that the trend is about to reverse. Chart # 16 shows hidden bullish divergence. You can also see a 3p Hidden Bear Divergence in Chart # 13 of Intel.
CHART # 16 – HIDDEN BULLISH DIVERGENCE
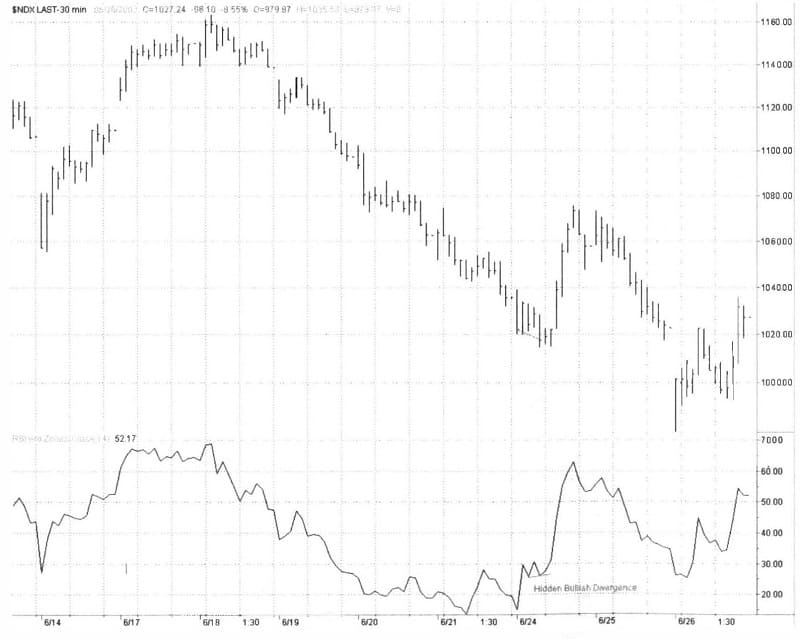
In Chart # 16 Note a hidden bullish divergence showed up beneath the 30 level after a 9 period simple bullish divergence. Immediately after forming the pattern, prices had a significant bear rally. Notice that the Bears stopped the advance when the RSI value approached 60.
Building a chart that combines a 9 period RSI and a 9 period Stochastic Indicator (slow) is a method that can be used to identify strong multiple divergences indicating strong contra-trend retracements or possible trend reversals. The exact pattern that we are looking for is three or more simultaneous long-term divergences in the RSI and Stochastic charts. When this occurs, you not only exit your position but reverse positions by taking a smaller than normal position 1 or 2 ticks above the high or low of the second peak or trough.
CHART # 17 – RSI & STOCHASTIC WITH 3 SIMULTANEOUS BULL DIVERGENCES
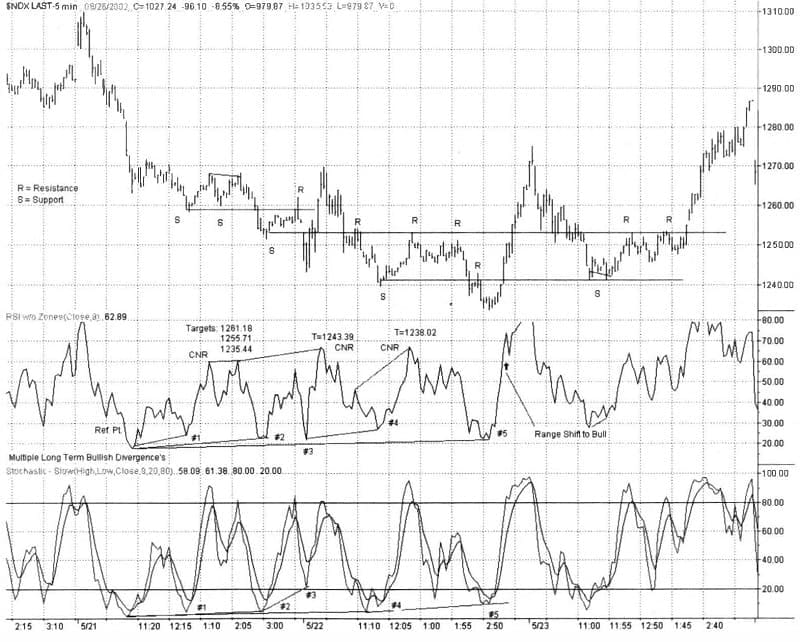
Chart #17 Notes: In the RSI, we have multiple medium term bullish divergences at: 1 (against the reference point) and 3 (using 4 as a reference point). We have long-term multiple divergences at: 2, 3, and 5 all against the reference point. Point # 4 is not a long-term multiple divergence as it is not under #3 and above the reference point. In the Slow Stochastic, we have medium term bullish divergences at 1 (against the reference point), 2 (using 1 as a reference point) and 3 (using 2 as a reference point. We have multiple long-term divergences at 2, 4, and 5 (all against the reference point). Point #3 is not a long-term bullish divergence for the same reason #4 in the RSI was not.
- I added some information to this chart regarding MDRP DOWN signals. We will discuss these signals in the next section. What is noteworthy is that we were able to project downside targets that were eventually hit. This entire time, we did not see any bearish divergences and the RSI stayed under 60. I marked the chart showing when the Bulls were able to gain control when they were able to push the RSI above 60. Also, take note of the semi-hidden bullish signal on May 23, 2002 around 11 :30. We can see how the price that coincides with the divergence point often becomes future support or resistance, which will be useful with our stop placement.
- End of Chart # 17 Notes.
As in life, there are exceptions to every rule. With the exception of three or more long-term bearish-bullish divergences and hidden divergences, the appearance of a simple divergence is a very strong indication that the trend is opposite of what the name implies. When a simple divergence is encountered, the only trade strategy that can be employed is to exit some (or all) of the trade position. Once prices begin to retrace the preceding trend and a contra-trend move or retracement is seen, the price that coincides with the RSI peak or trough becomes a key price. This price will often prove to be temporary support/resistance once the preceding trend re-asserts itself. Once the price has negated this temporary support, this price area may be used as a stop.
An Uptrend is indicated when:
- 1. RSI values remain in an 80/40 range
- 2. The chart exhibits simple bearish divergence
- 3. Hidden bullish divergence are seen
A Downtrend is indicated when:
- 1. RSI values remain in a 60/20 range
- 2. The chart exhibits simple bullish divergence
- 3. Hidden bearish divergence i s seen