Trading Articles
The Slow Volume Strength Index (SVSI) By Vitali Apirine
Here’s a momentum volume oscillator that’s similar to the relative strength index (RSI), but there’s a difference. Let’s take a look at how this indicator works. The slow volume strength index (SVSI) is a momentum volume oscillator that measures the change in buying and selling pressure relative to a price exponential moving average (EMA). I use J. Welles Wilder’s relative strength index (RSI) formula to calculate the SVSI. Similar to the RSI, the SVSI oscillates between zero and 100. SVSI is considered overbought when above 80 and oversold when below 20. The SVSI can also generate signals by looking for divergences and centerline crossovers. SVSI can be used to confirm the slow relative strength index (SRSI) on the same graph. I discussed the SRSI in my article “The Slow Relative Strength Index”.
Calculation
To calculate the SVSI, I use the following formula:
SVSI = 100 – [100/(1 + SVS)]
SVS = Average positive volume/Average negative volume
- The SVSI measures buying/selling pressure relative to a six-day EMA
- Closing price is used for calculating the EMA
- Volume is positive when the close is above a six-day EMA
- Volume is negative when the close is below a six-day EMA
- Negative volume values are expressed as positive values, not negative values
- If the closing price equals a six-day EMA, then volume = 0 (no change).
I used smoothed positive and negative volume values using Wilder’s smoothing technique as presented his book New Concepts In Technical Trading Systems. The first positive/negative volume values are the simple 14-day averages. Subsequent positive/negative volume values are smoothed by multiplying the previous 14-day positive/negative volume values by 13, adding the most recent positive/negative volume values and dividing these totals by 14.
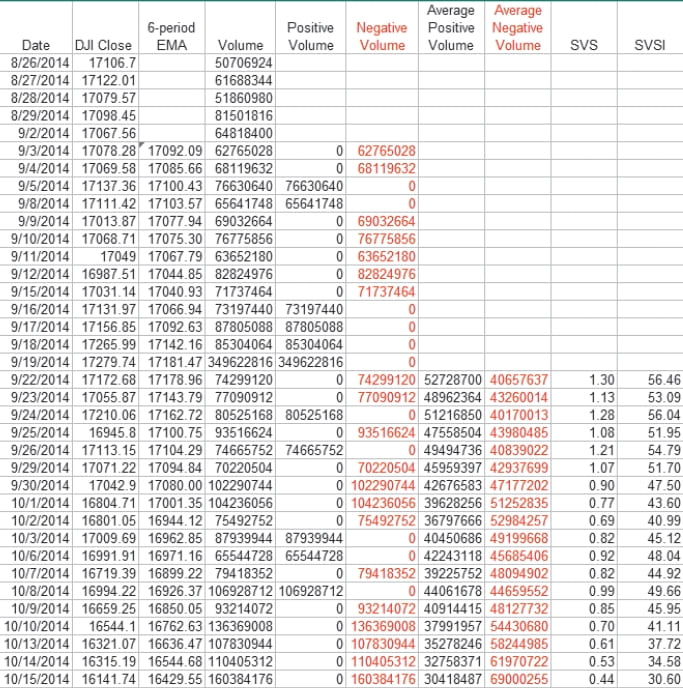
If average negative volume equals zero, then you get a divide by zero situation in the SVS and by definition, SVSI is set to 100. A value of 100 means closing prices moved higher than a six-day EMA for all 14 periods. There were no negative volume values to measure. SVSI is zero when average positive volume equals zero. A value of zero means closing prices moved lower than a six-day EMA during all 14 periods. There were no positive volume values to measure. The table in Figure 1 shows an example of how SVSI is calculated in an Excel spreadsheet.
Parameters
The values of 6 and 14 are the default settings used with the SVSI, but you can use other values depending on your trading style and goals. SVSI is considered overbought when above 80 and oversold when below 20. These levels can also be adjusted to better fit the security.
Overbought/Oversold, Centerline Crossovers, Divergences, and Trend ID: The SVSI is shown together with the SRSI in the same subchart on all charts displayed here. These two indicators confirm each other.
Suggested Books and Courses About Trading With Indicators


The chart in Figure 2 shows the Dow Jones Industrial Average (DJIA) with SRSI (6,14) and SVSI (6,14) during a volatile period in 2011. The DJIA dropped and SRSI was oversold in early June, bounced and made a higher high (June–July 2011), but SRSI and SVSI made lower highs. The bearish divergences were confirmed by bearish SRSI center-line crossover, SVSI momentum break-down, and a break below support in the DJIA in late July/early August. SRSI and SVSI were oversold in early August and the DJIA bottomed in early October. DJIA recorded a lower low but SRSI and SVSI formed higher lows. The bullish divergences between price and indicator were confirmed by the breakout above the resistance level by the DJIA, the SRSI bullish centerline cross-over, and the SVSI momentum breakout in October. In late October, SRSI and SVSI were overbought.
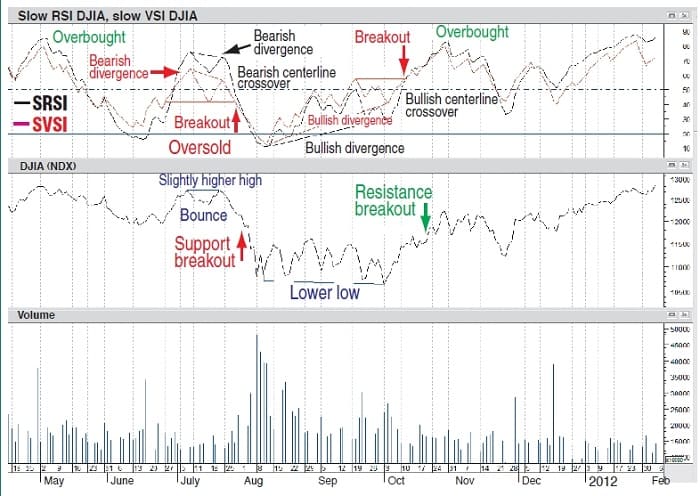
Whether prices move sideways within a range or in a moderate up or down channel, the SRSI and SVSI can identify when prices peak or reach a bottom.
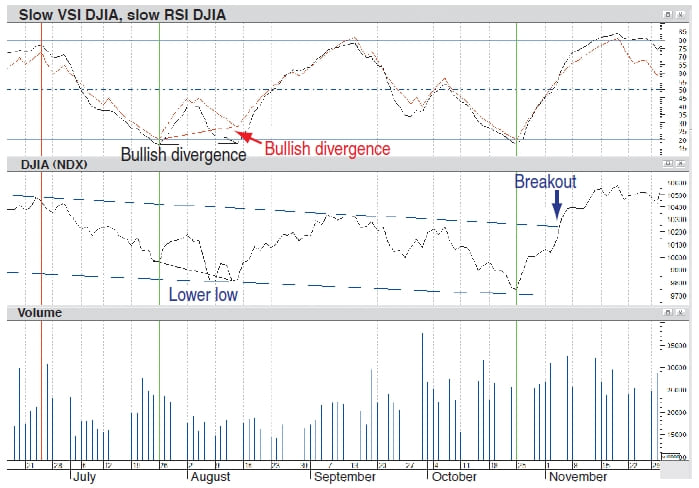
The chart in Figure 3 shows the DJIA in a falling channel. The subchart above the price chart displays the SRSI (6,14) and SVSI (6,14) from June to November 2004. The DJIA peaked when SRSI and SVSI reached, or were close to, 80 and bottomed when SRSI and SVSI reached 20. The DJIA went on to make a lower low, but SRSI and SVSI formed higher lows in July and August. A bullish divergence between price and the SVSI and SRSI was formed.
The weekly chart in Figure 4 shows the DJIA with SRSI (6,14) and SVSI (6,14) from February 2002 to December 2008. The SVSI bullish momentum breakout in late April 2003 and the SRSI bullish centerline crossover in early May 2003 were confirmed by a breakout above the resistance level at the end of May 2003. The SRSI and SVSI surged above 80 in late 2003 and then moved into a bull market range from 34 to 95 with the 34–50 zone acting as support. These ranges may vary depending on SRSI and SVSI parameters, strength of trend, and the volatility of the underlying security. SRSI broke below the momentum support zone (34–50) in January 2008. SVSI did the same in late February 2008. The DJIA broke support in the beginning of March 2008.
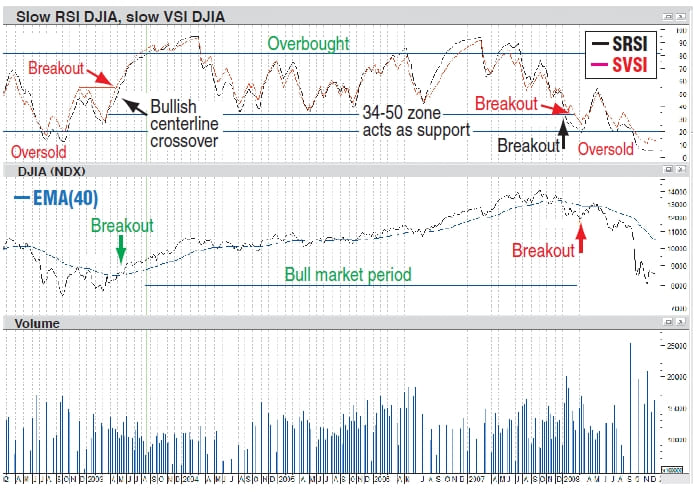
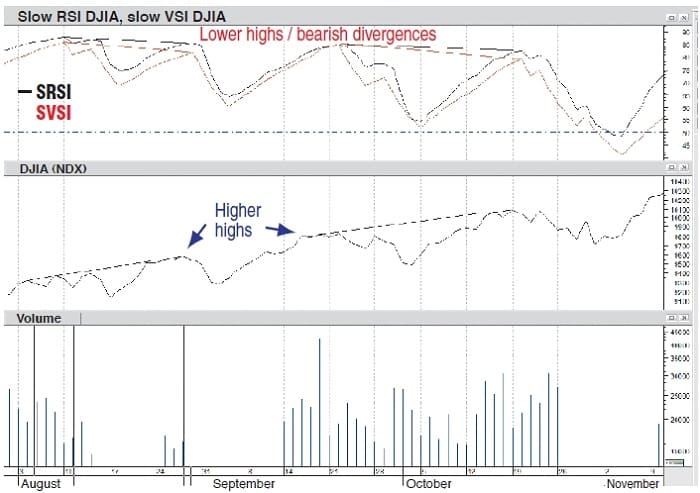
The SRSI moved below 20 in early March 2008 to signal the start of a bearish move. It is not unusual to see bearish divergences during a strong uptrend. These divergences could indicate short-term pullbacks and not necessarily a trend reversal in the opposite direction. The chart in Figure 5 is of the DJIA from July to November 2009 with two SRSI/SVSI bearish divergences and a continuing uptrend.
The weekly chart in Figure 6 shows the DJIA with SRSI (6,14) and SVSI (6,14) from March 1999–November 2003. The DJIA was within a falling channel and the momentum in both SRSI and SVSI started to drop from early 2000 to summer 2001. The DJIA broke the channel trendline support and SRSI was oversold in September 2001 to signal the start of a bearish range with the 50–70 zone acting as resistance. After the DJIA bounced and started moving up from September 2001–May 2002, the DJIA broke support in early June 2002, which was confirmed by an SVSI support breakout above the resistance zone and the SRSI bearish centerline crossover.
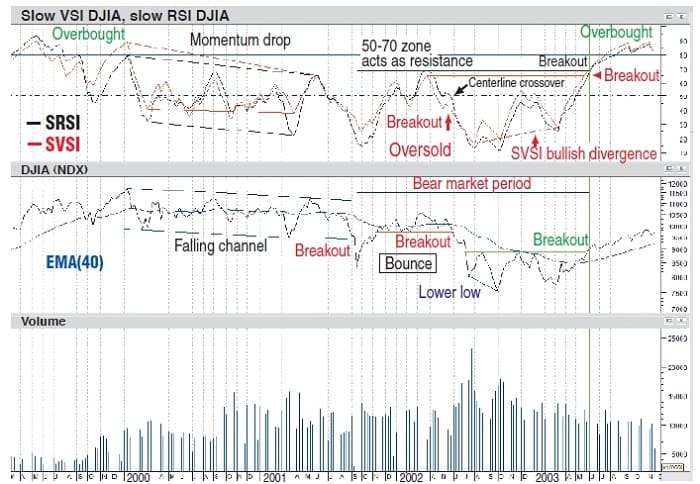
In July 2002, the DJIA dropped, and the two indicators—SRSI and SVSI—fell below 20. The DJIA bottomed in March 2003 with the SVSI forming a bullish divergence. This divergence was confirmed by an SVSI breakout, a DJIA resistance breakout in late May 2003, and an SRSI breakout in early June 2003. SVSI was overbought in mid-July 2003 and SRSI became overbought a month later.
Those Peaks & Troughs
Since it uses volume and price to measure buying & selling pressure relative to the EMA, the SVSI can be useful in detecting momentum. Typically, SRSI and SVSI move in the same direction. SVSI rises when the volume on up days outpaces volume on down days relative to the EMA. Conversely, SVSI decreases when volume on down days is stronger than volume on up days relative to the EMA. Whether prices move sideways within a range or in a moderate up or down channel, the SRSI and SVSI can identify when prices peak or reach a bottom. An overbought SVSI (above 80) can be a sign of strength. Conversely, an oversold SVSI (below 20) can be a sign of weakness. Bullish/bearish divergences can also generate good buy/sell signals during sideways movement but don’t work very well during pronounced trends. The SVSI can be used with the SRSI on the same graph to make it easier to spot turns in the SRSI and increase the robustness of your signals. The SVSI can be used with other indicators or price analysis techniques.
Vitali Apirine is a programmer engineer with an interest in technical analysis, especially the application of relative strength index to trading. He may be reached at [email protected].