Trading Articles
The Search For Your Trading Style By Donald Pendergast

Here’s a simple trading method you can apply if you trade with a longer-term outlook. I hope my recent article, “Crash Course For Novice Traders,” caused you to reflect on the critical decisions that you’ll need to make before pursuing an aggressive program of trading or investing. If you haven’t read the article yet and you’re struggling to stay afloat as a trader and/or investor, consider taking a few minutes now and read that article, as it may help you locate significant areas of deficiency in your overall trading plan.
A Plan With A Long-Term Outlook
This time, I want to lay out the basics of a particular style of trading that may be suitable for investors and traders with a long-term outlook on the markets they follow. “Trend-following” is the term assigned to this mode of trading, a style that relies on mechanical system entry/exit triggers to open and close a trading position. Normally, the goal of a trend-follower is to stay in a trade as long as possible, relying on mechanical entries/exits to determine the holding period; normally, trend-followers don’t set price targets or scale out of winning trades, preferring to stay with their well-tested trend-following systems to make all of the decisions.
Trend-following (TF) can be a very profitable way to trade, particularly when a TF entry signal results in a 100%, 200%, or even 500% gain on a low-priced stock or commodity, one that embarks on a multimonth (multiyear) trending move to astounding price levels. Conversely, for the trader/investor relying on such methods, TF systems can also be frustrating, even nerve-wracking at times, especially since many TF systems sport win ratios of only 30–45%, and periods of system drawdown (DD) can last for extended periods of time. Nevertheless, there are many examples of successful TF systems that make consistently good money over long periods of time.
Keys To Success With TF Methods
These are the steps by which to succeed with trend-following methods:
- Backtest the system, preferably over a 10-year period that includes many market phases (bull, bear, sideways).
- Forward-test the system to further ensure the system is not overly optimized on the original data used for backtesting.
- Perform steps 1 and 2 on a variety of markets. If the system fails to deliver profits in most of the markets you follow, develop another system that does. The best TF systems are usually based on simple concepts such as volatility breakouts, price channel breakouts, and moving average crossovers, and they will usually work as well on commodities as they do on stocks and exchange traded funds (etfs).
- Once steps 1 through 3 are complete, then and only then should the system be traded with real money. Start with the smallest practical position sizes that you can, if trading stocks at a low-cost brokerage (say, with $1 stock commissions) starting off with $500 allocations per trade will enable you to experience some of the stresses that come with live trading, without living in the fantasy land of paper-trading. As your success increases, you can gradually increase your dollar or share allocations, confident that you already have a real-world trading system with a high probability of ongoing profitability.
If you can’t backtest a trading system, does that mean you’re locked out of trading TF methods? Not at all, but you’ll need to be aware that you’ll be flying blind in some respects, unable to access important statistics such as maximum draw-down, profit factor, win-loss ratio, consecutive winners, consecutive losers, and so forth. If you’re in this category, it may also pay to develop an eye for certain technical patterns and indications that may alert you to a high-probability trend-following entry. By doing this, you effectively become a discretionary trader/investor, rather than one who relies solely on a mechanical timing signal for entry and exit.
Certainly, you must at least have access to high-quality charts, a variety of technical indicators, and a means of scanning/exploring for new TF trade signals. If you want to follow a few markets, you could scan for entry/exit signals on your charts, confirming indicator crossovers, channel breaks, and so on.
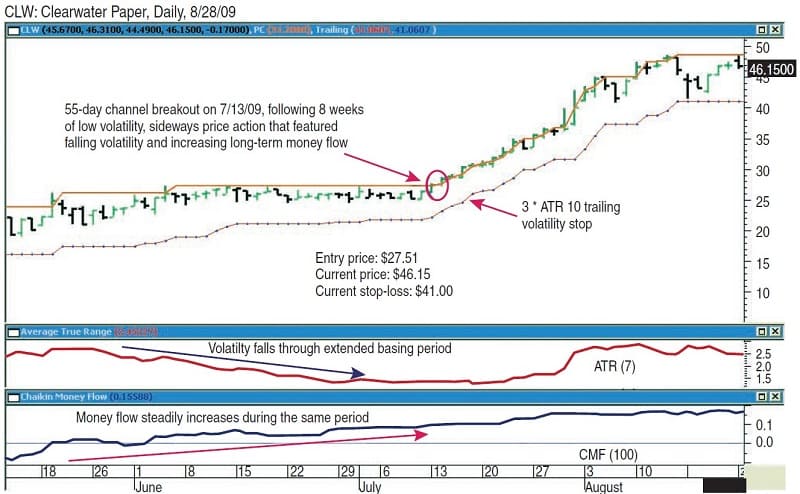
Figure 1 shows a recent, powerful trend-following move in a small-cap stock, Clearwater Paper (clw). The entry signal for this trade could have been programmed into popular charting/system development software packages such as MetaStock, Aiq, and TradeStation, among others, and each program has the means to automatically scan through thousands of tradables to locate the ones generating your desired TF trading signal entries and exits. Had you been tracking this particular stock, you would also have located the entry signal with little effort. Now, let’s look at the essential elements contained in one particular kind of TF methodology, one known as the flat-base breakout.
Trading flat-base breakouts under the right conditions is an attractive proposition for many traders.
Fiat-Base Breakout
The chart of clw is a prime example of a flat-base breakout, one that initiated a tremendous trend-following move in its wake. First, note the period of sideways price action that lasted for approximately eight weeks. As the consolidation played out, two important technical clues made their respective appearances, the powerful combination of which ultimately led to the 55-day price channel breakout on July 13, 2009. The first clue was the progressive drop in daily volatility in clw shares, as measured by the average true range (Atr) (7) (displayed in the panel just below the price chart; see Figure 1). This indicator can be a reliable early warning indicator when it comes to predicting potential price breakout moves, especially when the Atr withers down to historically low levels for a sustained period of time.
The Atr (7), which measures the average daily noise (or daily price range) in a given stock or commodity (in this case, averaged over seven trading sessions), was nearly $3 per day at the beginning of the basing period (mid-May 2009), falling rapidly to the $1.50 level at the time of the 55-day price channel breakout. As this was playing out, the long-term Chaikin money flow (cmf)(100) (the lower panel) was trending higher for the period of the price consolidation. A skilled technician following this particular stock with these indicators overlaid would have taken note of the falling volatility/increasing money flow combination, especially since the stock was carving out a textbook-quality, flat-base pattern, one that was also hugging the 55-day price channel line (orange line on chart).
In Context
Once the technician had factored all this bullish technical data in context, especially since clw was a stock with solid earnings growth potential, he or she would have waited for the stock to tip its hand with either a bullish breakout above the price channel or a bearish breakdown of the pattern back to lower price levels. In case you’re wondering what’s so special about the number chosen for the price channel — 55 — the answer is simple; a certain breed of modern trend-follower tends to focus on longer-term channel breakouts in the range of 40 to 60 periods, and the 55-day channel breakout was also one of the systems used by Richard Dennis and his Turtle Traders, starting in 1983.
The Turtles made money with a system like this one, focusing on the commodity futures markets. Regardless, the system also works great on stocks, providing you make a few adjustments, paying special attention to long-term money flows, average true ranges (Atr), and most important, the existence of an attractive flat-base pattern.
Suggested Books and Courses About Trend Trading


clw certainly had all of those wonderful factors in place on July 13, 2009, the day of the first daily close above the 55-day price channel line. Price immediately followed through the next trading session, and for all intents and purposes, the breakout was a go. If you look below the price bars, you’ll note the red dotted line. This is a trailing stop, designed to progressively limit losses and ultimately lock in a large percentage of profits as the stock (hopefully) moves in the desired direction to higher price levels.
Once again, the Atr calculation is called upon to help create the parameters for the trailing stop; in this case, the stop trails the daily closing price by three Atrs, averaged over a 10-day period. The idea is to give the stock plenty of room to back and fill so that random, inconsequential price corrections won’t stop the trade. Since the flat-base breakout is a precursor to many long-term trend-following moves, using a trailing stop is preferable to the use of a close or hot stop, one that might be more suitable to shorter-term swing trade setups.
Once in the trade, with the proper stop-loss placed with your broker, the job of managing a flat-base breakout trade is a relatively simple affair — you’ll allow your trading software to automatically calculate and then plot the updated trailing stop at the end of each trading session. All the trader needs to do is update the trailing stop with his/her broker before the next session’s open and then wait. Eventually, the trade will stop out, either for a gain or loss, and you’ll have another flat-base breakout trade under your belt.
CLW
So how did this flat-base breakout in clw turn out, anyway?Assuming an entry price on the close of July 13, 2009 (using a market on close [moc]), order would have been ideal, ensuring a daily close above the breakout channel line) of $27.45 and an initial stop-loss price of $22.20 (based on the three Atr-10 volatility trailing stop), the initial risk on the trade was $5.25. While that may seem like a lot of room for error, remember, we’re going for big moves every time that a valid flat-base pattern like this appears and we’re only going to risk 1–2% of our account value per trade, regardless of where the initial stop is set.
clw responded favorably in the wake of the mid-July breakout, rising to nearly $49 per share by late August 2009, and still well above its trailing stop, despite a near stopout on August 17, 2009. If the stock were stopped out now (as of this writing, late August 2009) at the current trailing stop level of $41.06, the trade would yield a gain of $13.61 per share, a nearly 50% increase in about six weeks. If we take $13.61 and divide it by the initial risk of $5.25, the trade returned an expectancy rating of $2.59 per dollar of initial risk. Not a bad return at all, but remember, trend-followers need to let every trade run without taking partial profits, lest their frequent losing trades eliminate all potential for consistent profitability. Just let flat-base breakout trades run until a final stopout, and you may be amazed at how far some of these trades can actually run.
Keep It Simple
So there we are: We’ve taken a detailed look at an effective, real-world trading strategy that newer traders may wish to focus on. Trading flat-base breakouts under the right conditions is an attractive proposition for many traders. Flat-base breakout trades can result in large trending moves, the trades require a minimum of attention during their lifespan and, best of all, such strategies can easily be programmed into MetaStock, TradeStation, Aiq Trading Expert Pro, and many other popular trading software packages.
Once programmed in, you can also back- and forward-test your flat-base breakout strategy to your heart’s content, determining how best to fine-tune your entry, exit, and indicator parameters. This particular trend-following strategy has a lot going for it, so take some time and begin working with this simple and effective trading methodology.
Donald Pendergast is a private trader and author.