Trading Articles
The Rubber Band Effect By Alexander Elder

Spike Trade.com is a group of 20 professional and semiprofessional traders involved in a weekly competition. Each member submits his or her pick along with the entry, target, and stop. The picks are submitted in private, and then all is revealed on Sunday afternoon. At the end of each week, the Spiker who wins that week’s competition writes up his or her analysis of the trade. In this article I will review the winning trade from the week ended February 19, 2010. The trader is Stephen M., a serious semiprofessional trader who is also an Idaho-based orthodontist. Steve is the newest Spiker, promoted for his excellent performance as a SpikeTrade member. Here is Steve’s analysis of his latest winning trade—AE
LONG HEV
The technical appeal of this trade of Ener1 (HEV) involved four factors (Figure 1):
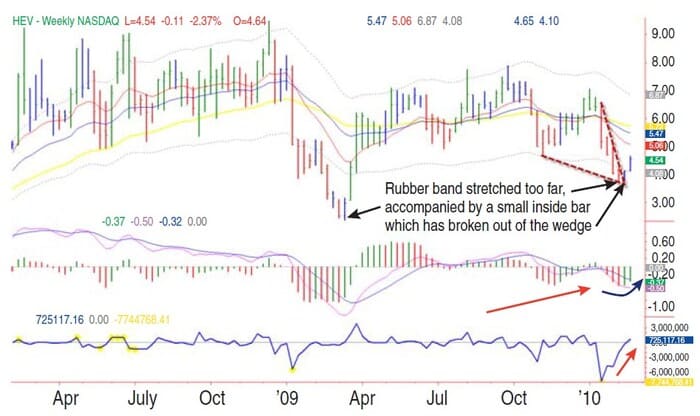
- A weekly descending wedge that had resolved to the upside at the end of last week. This caused the impulse system to turn blue as the share price closed back inside the envelope.
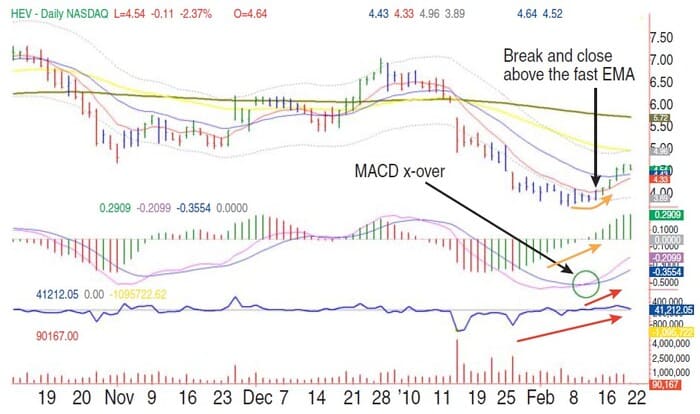
- The heavy exhaustive volume that pushed the share price to a low, and then a new low, finally stabilizing with a moving average convergence/divergence (MACD) crossover on the daily chart (Figure 2).
- The “rubber band” effect. The price had fallen too far from value and was due for a trip back to the mean. Interestingly, an identical pattern was present just prior to the March 2009 upside reversal.
- The high short interest ratio reflected the presence of too many greedy shorts, ready to get caught at the edge.
My trade plan called for the following:
- Entry: Buy on a slight pullback to the February 8, 2010, high of $4.10
- Stop: Place the stop below the low of Friday’s range at $3.93
- Target: Place it at the first break’s low of $4.90, which coincided with an interim low in July 2009.
PROGRESS OF TRADE
HEV opened on Tuesday after the Presidents’ Day holiday at $4.15. The stock climbed to $4.19, and then dropped to $4.10. I was filled at $4.11 (Figure 3). I was hesitant to pull the trigger at that point because it appeared that a false breakout could be in the making. Nevertheless, I remained confident in my assessment of the market and took the trade. A pennant-type consolidation ensued, after which HEV started to climb, taking out the high of the day and finishing strong by the end of the day.
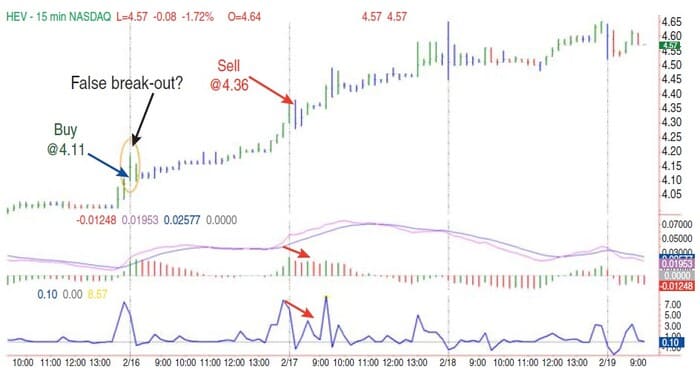
HEV shot out of the gate on Wednesday. It jumped up and then momentarily stalled at the slow exponential moving average (EMA). That is where I sold and took my profit, guided by the negative divergence of the force index. That Wednesday, after I sold, HEV reached a high of $4.65. Clearly, I could have and should have held for a much bigger gain. If I could do it over again, I would have tightened my stop as HEV fought the resistance of the 21-day EMA instead of selling the whole position. At worst, I would have given up a little more profit. At best, I could have doubled my return over interest (ROI). I could have sold half at this point and then trailed the stop on the other half.
Suggested Books and Courses By Alexander Elder


TRADE REVIEW
Alexander Elder comments: Steve’s trade raises two important issues on strategy and short-term tactics. The strategic issue is this: there are two main ways to trade — value trading and momentum trading. Value traders aim to buy low, sell high. Momentum traders strive to buy high, sell even higher.
Most choose between these two strategies on their gut reaction — on the basis of their own instinct and psychological attitudes. Momentum traders tend to be risk seekers, while value traders tend to be more conservative. Steve clearly prefers value trading, and it works for him: He currently leads the Spike group in equity gains. The question for every value trader is how to define value. Steve and I agree that value lives in the zone between two moving averages. When a stock trades above both EMAs, it is above value, and when it trades below them, it is below value. Prices are attached to value as if with a rubber band. When that rubber band becomes overextended, prices are ready to snap back.
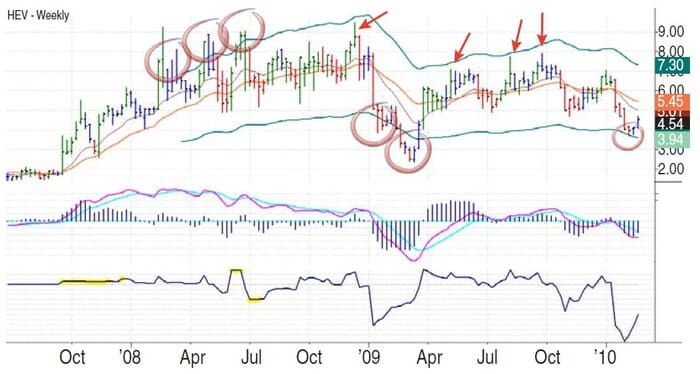
My favorite method of identifying overextended prices is by using two channel lines, parallel to the slow EMA (see Figure 4). When prices fall below the lower channel line, they mark a buying opportunity. When they rise above the upper channel line, they mark a shorting opportunity. Several occurrences are circled on the chart in Figure 3. Sometimes a rally does not Oct ’10 reach the upper channel line; a single bar reaches toward it and then falls away. Several such signals are marked with arrows on the chart.
The tactical question is where and when to take profits in a trade that starts going your way. Steve exited after seeing a bearish divergence of the force index, a very minor signal. He ended up kicking himself for not switching to a trailing stop. This technique is much favored by Kerry Lovvorn, my partner in SpikeTrade.com. Even with a premature exit, Steve bagged the best trade for the group during that week. His self-criticism shows that a successful trader does not rest on his laurels but continues to learn and improve on his methods. The SpikeTrade competition had been run 52 weeks a year. Let’s see what lesson we can learn.
Alexander Elder is a professional trader based in New York City. He is the author of Come Into My Trading Room and Trading For A Living, considered modern classics among traders. He also wrote Entries & Exits and Sell And Sell Short.