Trading Articles
The RSI Miracle By Hadi Seyedinajad
If we had to choose just one indicator to tradethe financial markets, it would be J. Welles Wilder’s RSI. It does everything you expect from an indicator. It’s an overbought/oversold alert system, a convergence/divergence detector, and a momentum indicator, but it can do even more. The old saying amid radical technicians, that “the price chart has everything you need,” is not just a slogan. The information that we can extract from price vs. time data is amazing and I am not sure what this reflects, human intelligence or the harmony existing in the universe. By reading a price chart we must develop mathematical functions of price. These are tools to help us interpret the raw price data or extract hidden information such as momentum or market pace.
There are different ways to measure momentum, each differing in their definition and calculation. The one that you have learned to interpret and that fills a gap in your market analysis would be the one you pick for your analysis. I have selected the relative strength index (RSI), which, in addition to identifying overbought/oversold areas, detecting divergences, and identifying momentum, also linearizes a trend. Price tops or bottoms are not always in a relatively straight trendline. By looking at the RSI, you’ll see that a perfect trendline often manifests itself. In this article I will present examples using the currency markets.
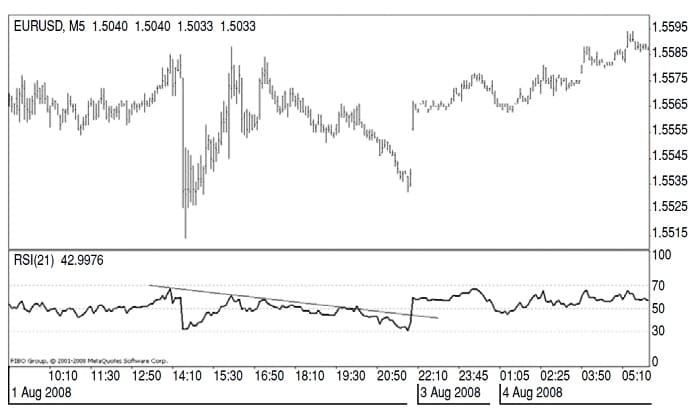
On the five-minute chart of the EUR/USD in Figure 1, you can see that although it is a choppy market, the RSI is not so. It has moved along its clear trendline. Seeing these lines looks like a discovery. This market behavior manifests itself well in RSI movements. My next step was to apply this behavior to my trading. So I combined my knowledge of the market using techniques such as Dow theory and Elliott wave counts together with reading market momentum through the RSI.
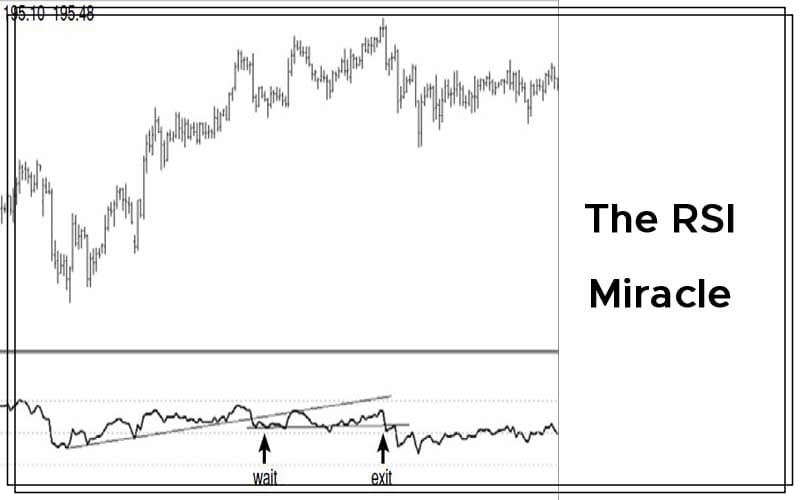
In its simplest form, the RSI gives you an exit signal in an optimized moment. It will signal a change in the market phase— enter from an impulsive phase to a corrective mode or change direction — quickly. So having a clear RSI trendline brings you enough confidence to stay with the trend and exit at the best time. Usually, when the RSI breaks the current trendline, it is a signal to exit your position. Before entering the market, you need to do a thorough analysis and once you are in the correct side of the market — that is, you have captured a price move— you often have a clear RSI trendline, which when broken will lead you to exit.
Suggested Books and Courses About Market Indicators


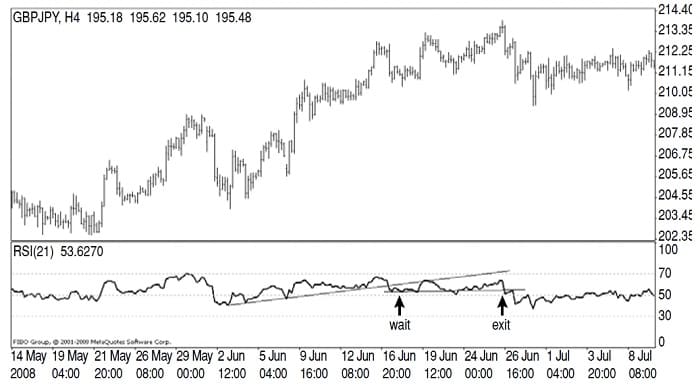
Here’s an example. On the five-minute chart of the GBP/JPY in Figure 2, at point A, I enter a sell position. The price at point A was breaking the lower trendline of a diagonal triangle at the end of a five-wave up, confirmed with breaking a previous RSI up trendline (line 1) in a relatively overbought area of the indicator. You can see that at point A, RSI has rebounded from a newly formed trendline moving in the opposite direction (line 2) that conforms to the direction of my sell position. This acts as a confirming tool. Now I just sit back and wait till the RSI violates the downward trendline.
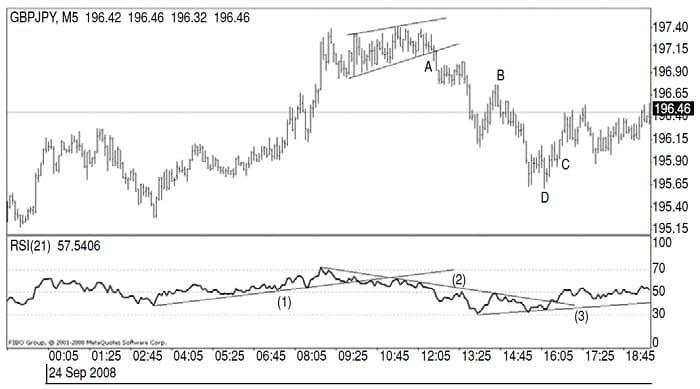
At point B, while a relatively deep correction appears to be unfolding, I am still in the market because the trendline of the RSI is still trending down. Eventually at point C, the RSI breaks above line 2, at which point I exit the position with a profit of approximately 90 points. One thing to note here is that the RSI cautioned us before breaking line 2. A new trendline started forming, line 3. Consequently, you might have exited at point D when the RSI was bouncing along line 3, indicating a change in trend was approaching. In addition, the indicator was oversold and had not broken below line 3.
This is a classic example in how to read RSI by way of its trendlines. I have used it as a confirming tool to make my entry decisions. But often it cannot be used by itself. You need to do an overall market analysis. The last point I am going to mention is how you could stay in a trade, even if the trendline is broken. Because of divergences that occur during the final steps of a trend, for example, between the top of a wave 3 and wave 5 (Elliott wave counts) of an impulse wave, we can capture the last price swing, even though the RSI may be turning. Wilder calls these patterns failure swings. You do need to exercise some patience, provided you have enough expertise to identify a failure swing properly. You must wait until the last peak (support or resistance) in the RSI breaks (similar in concept to the neckline in head & shoulders price pattern). You can see an example in Figure 3.
Wilder and analyst John J. Murphy have both gone into detail about this. However, I don’t feel comfortable applying this method, since I prefer to exit earlier rather than experience such complex scenarios in RSI. Note that remaining in the market in this situation would be profitable, but not by the means of RSI, when it has broken its trendline. You could surely use the Elliott wave, for example, to let the profits run. You can also read more about divergences in articles by technicians Barbara Star and Martin J. Pring.
THE TIP OF THE ICEBERG
This is just a glimpse of what you can do with the RSI. Although the examples cited here are for the currency markets, the methodology can be applied to any security. Different situations will arise, and it is best to gain some experience and familiarity with the indicator. I must mention, however, that neither the RSI nor any other mathematical function of price can capture positions with 100% accuracy. Indicators, with all of their powerful functionalities, are simply studies that you can use in addition to price chart analysis.
Hadi Seyedinejad, MSc, is a student of mathematics in Sharif University of Technology. One of his main mathematical application interests is finance and the financial markets.