Trading Articles
The Market Instrument Function By Alexander Ershov and Aleksey Gerasimov
Can you really determine future price movement? This unique method tries to do just that by analyzing collective patterns that form in a market. Financial market analysts often attempt to predict the behavior of a specific financial asset and provide recommendations for investors. But for practical reasons, the prediction horizon is frequently limited to several months, if at all. As a result, although the current price levels may be well understood, how that financial asset achieves a level may never be mentioned.
In forecasts prepared by analysts, oftentimes the data on the price chart corresponding to the last trading day is missing. We offer an approach that allows you to calculate this missing data with a prediction horizon that varies from three to nine years, depending on the security. Modern technical analysis may only be able to advise you on what should be done at a specific point for a given day or hour, but it doesn’t say much about the general future behavior of an asset. Accordingly, trading systems are intrinsically probabilistic, based upon similar principles. This allows us to analyze the trading systems instead of a financial market, which does not help us to establish collective patterns of future behavior for prices.
MAIN TASKS
Consider one of the possible models of a marketplace based on these criteria:
- At any given time, any market asset is characterized by its price level and the way this level has been reached. The asset can be described by a graph showing all the price changes.
- The set of laws affecting price formation can be separated into an isolated unit. Graphically, this can be represented by a device that generates its current price using its own inner laws.
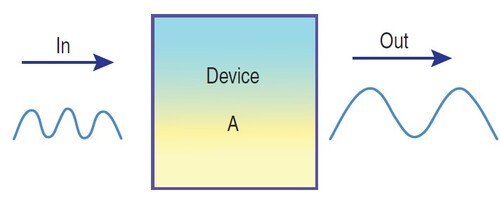
At any given time, we have a history of price changes as an input, with device A (Figure 1) converting it into an output signal, helping to determine a future price trend. Let us assume that if there is a limited and constant number of collective patterns forming a market, it is possible to establish a general mathematical law describing future price movement. To achieve this, we need to look at the history of price changes and the fundamental market characteristics as a unification of multiple underlying laws that affect pricing.
This approach is hardly novel, and it has been used in the analysis of systems. In this method, a function that characterizes a device converting the input signal into an output signal is referred to as a device instrument function. In optics, it is known as a slit function; in electrical engineering as a unit-impulse response function, or influence function, or Green’s function. By the same token, a function that converts price history into predictable future changes could be called a market instrument function.
THE MARKET INSTRUMENT FUNCTION
For any device that transforms an input signal into an output signal, it is possible to formulate three main problems by calculating:
- The instrument function using an input and output signal
- The output signal using an input signal and the instrument function
- The input signal using an output signal and the instrument function.
Clearly, the first two problems are more relevant to market forecasting, since they focus on the market device’s hidden structure and the laws that govern the output movement. The third is only relevant when you want to determine how the device distorts the input signal, such as registering light pulses or photocounts. It may be difficult to calculate these distortions, but present-day mathematical methods allow us to do so with a considerable degree of accuracy.
Naturally, it is not easy to say whether an instrument function of a market exists. Yet we assume that several factors can help us to define the movement of the market. The following factors led us to this assumption:
- Availability of credit, tax, or seasonal cycles; the periodicity of company reports; Presidential election cycles.
- Existence of a large number of various trading systems and programs. These are all based on well-known market indicators.
- Natural cycles that have always had a significant impact on the overall market activity and behavior of its multiple components. This may include the cycles of solar activity, lunar cycles, and so on.
- Regular patterns in decision-making behavior typical of most market participants that is unlikely to change.
All these and other recurring factors constitute the hidden internal structure of the device, which we have identified with the market. Generally, we should not be interested in the economic principles that control the market mechanism. It is enough to know that they exist and they are constant. You may be confronted with the same problem — that is, the need to take into account each and every law affecting the market economy. That may be difficult to accomplish with each individual type of security. That would result in the wrong superposition of internal factors taken at different times and combinations, which can lead to unpredictable outcomes.
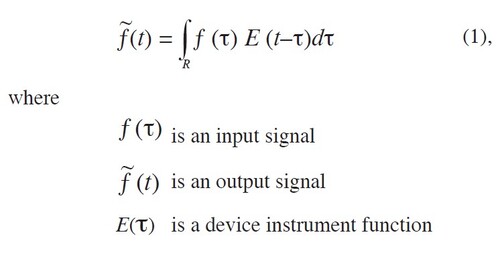
Luckily, even though the fundamental laws defining the market may be complex and ambiguous, in reality, we don’t even have to know all the ins and outs in order to predict future price movement. It is enough for us to know that these laws exist! Combining an input signal, a device, and an output signal is typical for the mathematical processing of experimental data. We know that the response of a device to an external influence can be described by a Fredholm integral equation of the first kind:
In terms of mathematics, the device you see in Figure 1 and the integral equation (1) are essentially the same. If you cannot measure the characteristics of a process, you would only be able to measure an indirect representation of its output signal. To overcome this, we would build a theoretical model that would determine an ƒ (τ) function, or an instrument function of that hardware device. This characteristic can be obtained from the integral equation (1).
Suggested Books and Courses About Algorithmic Trading
But our case is different. We split the history of a market asset into two and studied the first part as an input signal and the second as an output signal, or an outcome of the instrument function. Thus, our task is to solve the integral equation of the first kind (1) for the E(τ) instrument function with the known parameters ƒ (τ) and ƒ~ (t) . The instrument function may be a generalized function.
After determining the market instrument function for a particular security, the function can be applied to historical prices. This can be represented as a curve of the price movement for the asset in question. The mathematical technique used to obtain the instrument market function and create a chart of future price trend may seem complicated. For a brief discussion of the mathematical methodology behind the market instrument function, see the sidebar, “Mathematical Discussion.”
OUTCOME
Using the principles discussed in the sidebar, we found a solution to the integral equation of the first kind with respect to the instrument function and were able to prepare a forecast for a large set of stock market securities. As a result, we were able to show the market trend on the last trading day to obtain the right side of the price chart. These outcomes also show the time frames within which one trend replaces another. Even though it was difficult to detect the finer structure of this movement, the basic trends and shape of the curve for future prices were determined correctly. Moreover, it was possible to establish not only the movement of the financial market as a whole, but the trend of each individual security for medium-term (from six months to one year) and long-term (two to five years) periods.
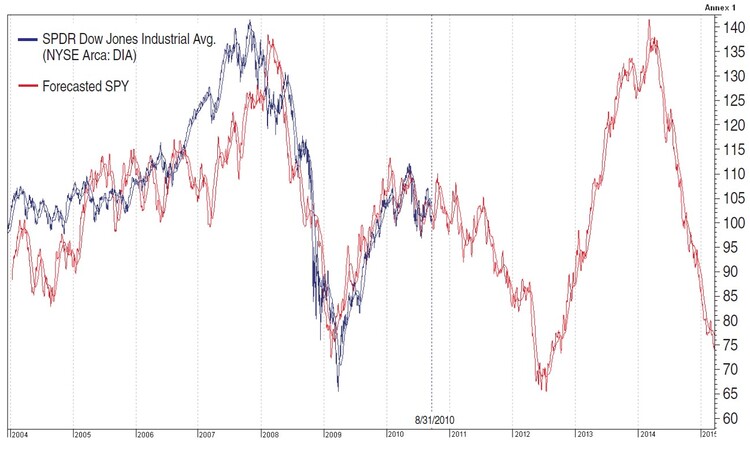
After building the forecast for exchange traded funds (ETFs) such as DIA (Dow Jones Industrial Average) and SPY (Standard & Poor’s 500), we realized their recent trends were mostly identical so future price curves are similar. The forecasts may still differ, however, sometimes significantly, for each security. In the charts of two liquid ETFs, DIA (Figure 2) and SPY (Figure 3), the blue curve represents the actual price movement and the red curve the forecasted movement based on the instrument function. The time horizon is 1,245 trading days (or about five years). As you can see, a second wave of the crisis will begin in the middle of 2011 and reach a low by August 2012, when the market should see the levels of February and March 2009.
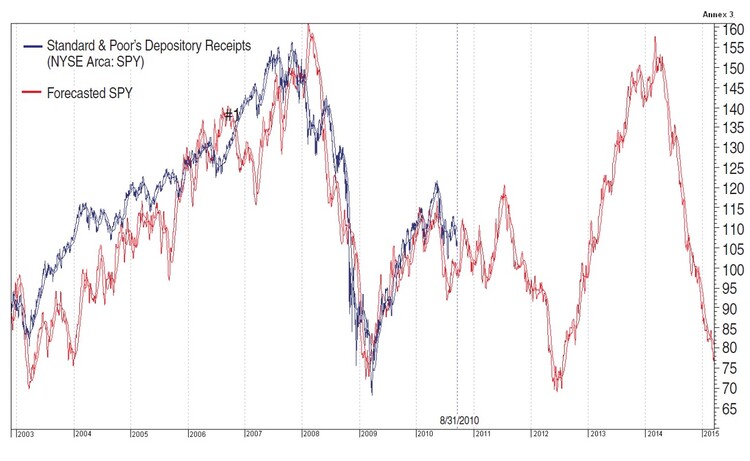
Once the forecast is built, it does not change after historical data is added. Remember that the prognosis for DIA and SPY had been built 1,245 days before the actual prices were plotted. The plots show how accurately the prices follow our forecast.
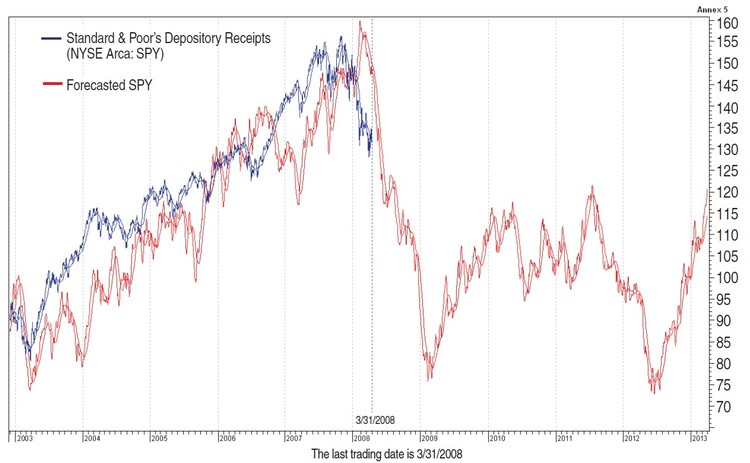
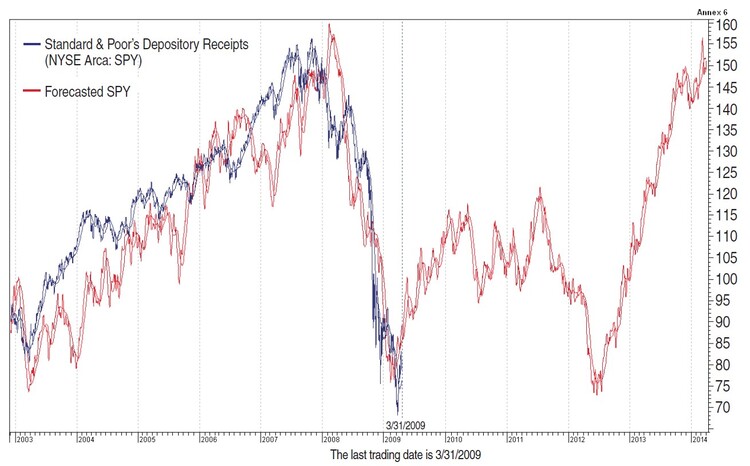
In Figure 4, the forecast of SPY was made on March 31, 2008. In Figure 5, the forecast was created on March 31, 2009. The difference between these two figures is the date of the last trading day. You can see that in March 2008 we could forecast to the end of March 2013 (Figure 4), and in March 2009 we predicted the future movement until the end of March 2014 (Figure 5). Try to visualize a chart with the forecasted movement drawn and the actual prices following it. This may look like a cyclical occurrence but the appearance of these cycles doesn’t mean a repetition of similar events or the shape of the price trend at regular intervals. Instead, it means that prices of the forecasted day may be affected by the current price via the instrument function. The market is thought to reflect its own state for the next five years from the current date.
Determining the instrument function should be done on securities that are sufficiently liquid and with a long trading history. Securities with a history of fewer than 4,000 trading days cannot be used to build a forecast using our method.
FINDING THE MISSING DATA
The obvious advantage of the instrument function method is the ability to build a detailed long-term forecast of price movement. More important, this forecast is not prone to the subjective views of market analysts. With the market instrument function, the market is arranged and studied in detail so its specifics are made redundant and reflect all the major market properties.
Aleksey Gerasimov was engaged in the research of mathematical physics and quantum radiophysics before founding his own company. Since the late 1990s he has been studying the world stock market.
Alexander Ershov has been studying the application of mathematical methods of signal reception to stock market forecasting since the early 1990s.