Trading Articles
Suspect Trends By L.A. Little
Do you get the feeling that the trend is changing? Here’s how to confirm or deny that suspicion. Robert Edwards and John Magee first published their Technical Analysis Of Stock Trends in 1948. In technical trading circles, this book has come to be known as the bible of technical analysis. It is perhaps the most definitive book on pure technical analysis, as it pertains to strictly reading chart patterns. In their classic work, Edwards and Magee define trends. Their definition of trend is the classical definition (that is, the tendency or proclivity for the price to move in a straight line), but for my work, their definition is insufficient. As a result, I have expanded upon it with the concept of suspect and confirmed trends. Let me explain.
TRADING WITH THE TREND
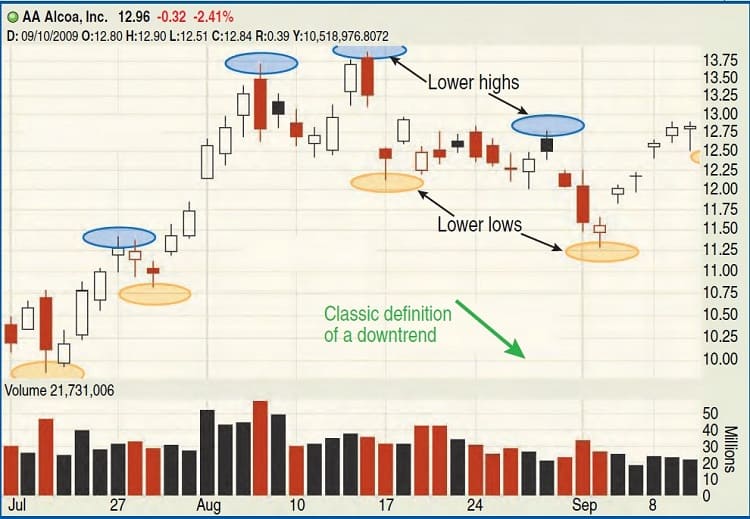
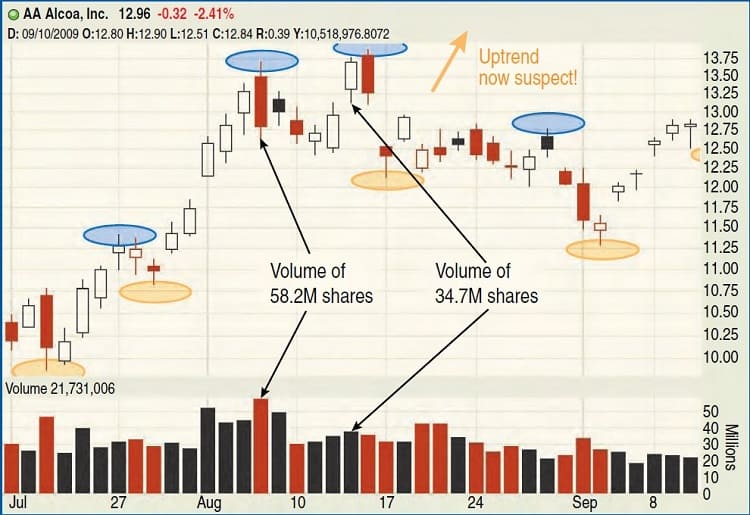
The classical definition looks at price only when defining an uptrend. For example, an uptrend is defined as a series of higher highs and higher lows based on price. To see this, take a look at Figure 1, a recent example of a short-term uptrend on Alcoa (AA) based on the classical definition. In this chart, you see on the lefthand side of the chart a series of higher highs and higher lows — an uptrend according to the classical definition of trend. In Figure 2 you see the same chart with the downtrend called out. You can easily see a series of lower lows and lower highs.
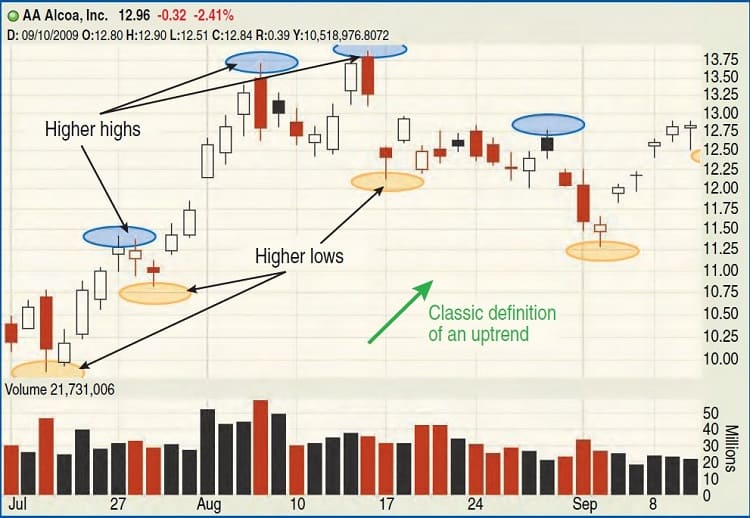
Given the generally accepted technical analysis notion that you want to trade in the direction of the prevailing trend, you would want to be long while the trend is higher and short when it is lower. Simple enough, right? Not quite. Assume you were long AA from the $10 area. When should you exit the trade? Looking at the chart and using the classic definition of a trend, when would you take all or partial profits? Unfortunately, with the classic definition, you would be unaware that the trend had changed until you witnessed a series of lower highs and lower lows.
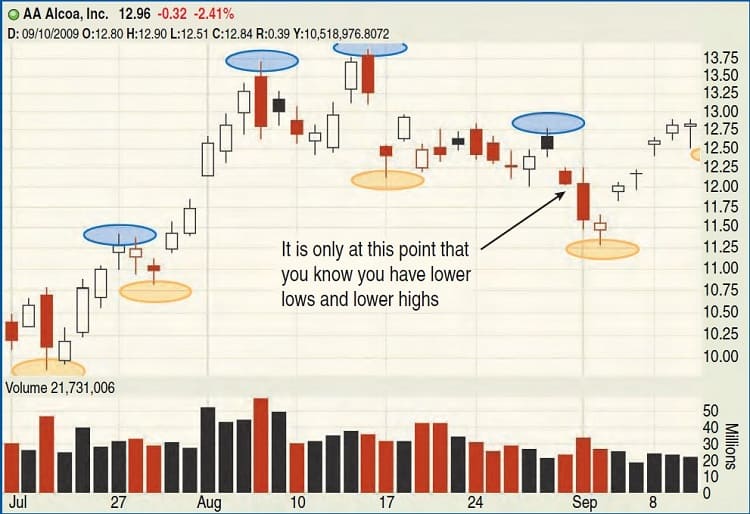
Now look at Figure 3. You would not know until you had a break of the previous swing low. That break occurs when AA trades to $12. If you used this signal to exit, you would be exiting at exactly the wrong time — when the trend was about to turn and become bullish again.
THE NOTION OF SUSPICION
What you need is a warning bell, a sign that the trend is no longer as strong as it previously was. Trends typically don’t change on a dime. There are usually warning signs prior to the change and the market issues them most of the time. Those warning signs surface at the swing points and are detected via volume examination. If you examine the volume characteristics of the previous swing point and compare it to the volume of the bar that closes over or under the previous swing point, then you can make the market prove the trend each time a new swing point is created for the time frame examined. A trend can thus be qualified:
- If volume expands when a new swing point is registered, then the trend is confirmed.
- If volume contracts when a new swing point is registered, then the trend is suspect.
Suggested Books and Courses About Price Patterns
Using this method, the market provides you with an early warning system regarding the quality of the trend. Look again at the AA chart (Figure 4) using this enhanced definition of trend. Using this enhanced definition, when AA traded over the previous swing point, it was clear that volume contracted. When that happens, the uptrend becomes suspect. That is your early warning sign. That is the signal that you should take action.
Remember, however, a suspect trend does not mean that the trend is guaranteed to fail; it only provides an early warning system that something is awry. It is a warning, a heads-up that you probably need to take action. That action could be to liquidate the position or to hedge it, or even to practice some basic money management principles such as taking partial profits. What you do depends on your time frame, your average entry price point, and so on.
ALL MARKETS AND ALL TIME FRAMES
In the previous example, we looked at a single stock and how the concept of suspect trends can provide you with an early warning system. This principle applies to all trends in all markets for all time frames. We can see this clearly through the use of a broad index such as the SPDR S&P 500 exchange traded fund (ETF)(SPY). In doing so, we shall examine the long-term, intermediate-term, and the short-term time frames. When setting up and managing a trade, it’s preferable to use all three time frames when making decisions. In the current market (Figure 5), what does the SPY tell us?
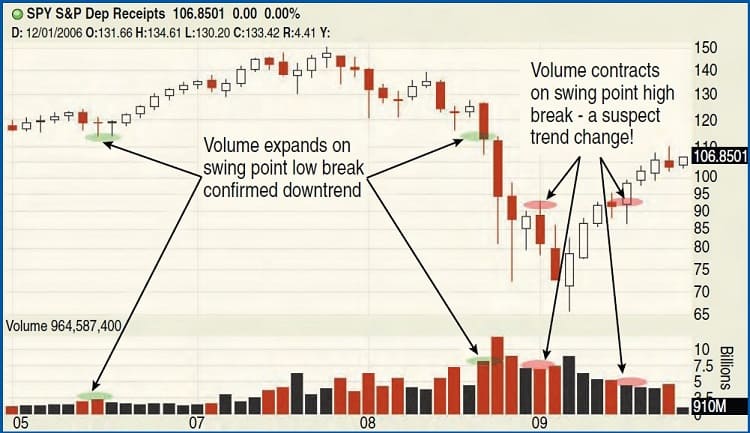
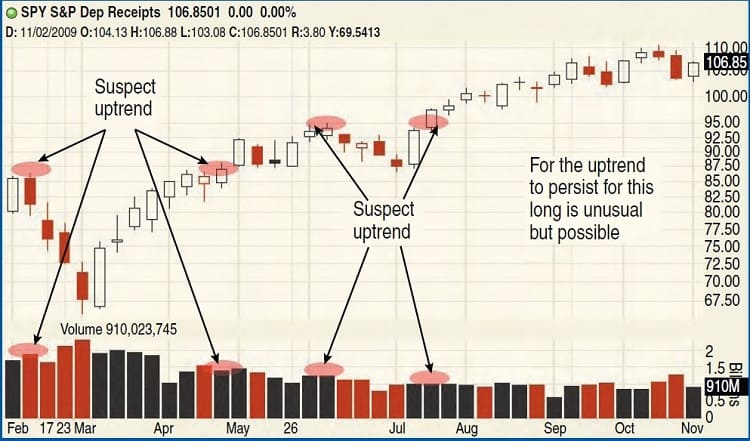
On a long-term time frame, the Spy Etf signaled that a downtrend was confirmed in September 2008. That was a warning sign and it didn’t take long for the warning to turn into a full-fledged bear market. Note how the current trend change is suspect. As prices traded over and closed higher than the previous swing point from January 2009, the change in trend was not confirmed but is instead suspect. On an intermediate-term time frame, we see the same sort of chart behavior — suspect trends (Figure 6). Again, on this time frame, warnings are being issued. This has occurred since May 2009 and so far it hasn’t mattered. It will, though, and prices will likely retrace to this area where suspicion began — eventually.
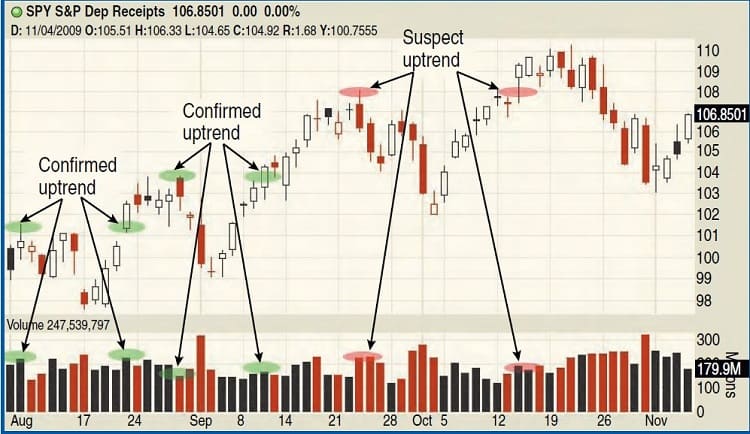
Turning to the short-term time frame (Figure 7), we can see how these suspect trends have persisted. On the shortest time frame, the market has continued to confirm the uptrend, which is why it has continued to climb higher. Only on this last swing point (high) break has the trend turned suspect. That can be corrected if volume were to surge and take out the next higher swing point that exists, but given the long- and intermediate-term time frames, that is unlikely. More likely is that this market finally begins to trade lower and correct the many nonconfirmation points that have occurred on the longer time frame.
ENHANCED SWING POINT
In your trading, it is important to have guideposts —something to help when wading through the trading waters. The concept of confirmed and suspicious trends, as viewed through the enhanced definition of trend, provides such a guiding light. As with anything in trading, it isn’t failproof. It is, however, a notable improvement in the classic definition of a trend and, when combined with wise money management, it can increase your odds of success.
L.A. Little is an author, professional trader, and money manager. His new book, Trade Like The Little Guy, shows small traders how they can consistently profit in the markets.