Trading Articles
Squaring Price with Time in Gann Market Analysis
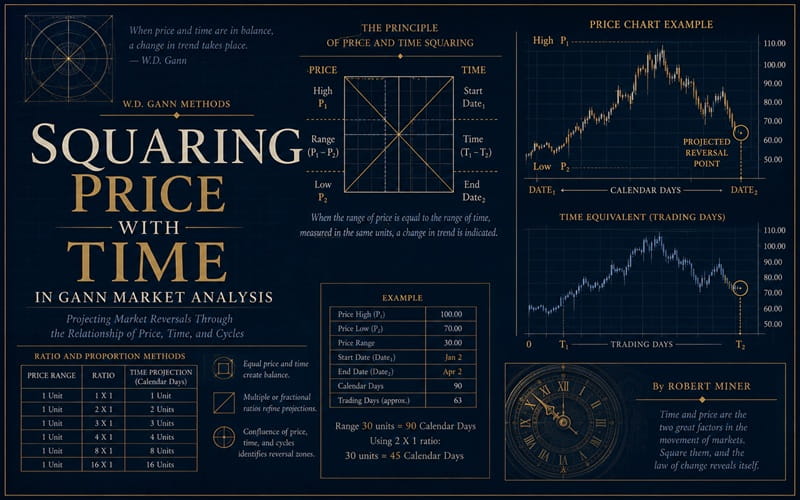
This is one of the most important and valuable discoveries that I have ever made. If you stick strictly to the rule, and always watch a stock or commodity when TIME and PRICE come together, you will be able to forecast the important changes in trend with greater accuracy. One of Gann’s most unique and important concepts for projecting market time/price reversals is the relationship of price and time. Gann called it “squaring price in time.” Important price highs, lows and ranges often project future time periods when minor and major trend reversals occur in the markets. The concept and technique is really quite simple.
The method to project highly probable time zones of future trend reversals from price extremes and ranges is identical to projecting future dates from prior time cycles. A price range or extreme is proportioned and multiplied by those important dynamic and static ratios of time and price that have proved to be prevalent in the markets. These values are projected forward in time by calendar day (CD), trading day (TD), weekly (WK) and monthly (M) counts from the date of the high. low or termination of the range. If these projected time periods coincide with time projections by other methods, resulting in a cluster of time periods within a narrow time zone, a market reversal is highly probable.
These price squared in time projections can be done either geometrical on a chart or simply by math and calendar counts resulting in a list of potential turning point dates. I prefer to do these projections by mathematically, as I like the least amount of clutter on my charts as possible.
Advanced Books and Courses on W.D. Gann Methods


Gann proportioned time and price cycles by static ratios or equal divisions of one eighths and one thirds. It is important to also proportion time and price cycles by the most important dynamic ratios represented by the Fibonacci number series. These ratios are .146, .236, .382 and .618. These ratios are even more prevalent inmost markets than the static ratios. Gann emphasized that these price in time projections should relate to trading day counts verses calendar day counts relative to daily counts. I have found that calendar day counts are as reliable and therefore just as important as the trading day counts. Calculate both calendar day and trading day counts. The trading day counts of any value will always be further out in time than the calendar day count. Weekly counts of the values are also important. I have not found price in time monthly counts to be particularly useful as the projected time periods from monthly counts are so far out in time that the time and price cycles prior to those distant monthly projections will more accurately indicate future dates.
Let’s look at some examples of price square time projections from past market activity.
September 26. 1988 = important Cycle Low 28= 1.67RTDDec. 14. 1987H-Feh.28. 1988L
28 = 1.236 RCD Feb. 25, 1985 L – Dec. 14. 1987 H
Let me explain my short hand symbols above. Sep. 28 was a date that fell 1.67 times the value of the price range of the Dec. 14, 1987 high to the Feb. 28, 1988 low by a trading day count from the Feb. 28, 1988 low.
December 2, t988 = High
2 = .75 RCD June 3, 1988 H – Sept. 26. 1988 L
5 = 3.142 RCD Dec. 14. 1987- Feb. 28. 1988L
February 17, 1989 = Low
15 = 1.382 RTD Sept. 26, 1988 L – Dec. 2. 1988 H 18 = 1.618 RCD June 3, 1988 H – Sept. 26. 1988 L
March 20, 1989 = High
19 = .5 RCD Dec. 2. 1988 H – Feb. 17. 1989 L
20=3RTDDec. 14. 1987H-Feb.29. 1988L
As you can see, each of these important highs and lows fell within two days of a square of a prior price range in time. Let’s look at a few future dates that will square in time with important prices.
September 1989
1O=.6I8RWKAug.25,t976L-Ian.2t.t98OH
(Range projected by a weekly count).
18 = 1.236 HCD Dec. 14, 1987 H (High price counted forward by calendar days).
25 = 1.25 HCD Dec. 14, 1987 H December 1989
3=1.382HC1J Dec. 14. 1987 H
Should time cycle ratios and time counts also fall near these dates, we would want to be very alert for indications of trend reversal. At this time ~July), the September 10 date coincides with several other important time factors. I would be particularly alert to the price activity within one week either side of this date for an important high or low. It is important for you to go back over past price market history and do the calculations and projections in order to prove to yourself the value of this profitable time projection technique. I suggest that you study one market completely. Calculate the time projections from the price of every major and intermediate cycle for just one market for at least the past 10-15 years. If you do this work, which is necessary, you will discover for yourself how profitable this technique really is. It takes very little time and effort to keep the calculations up to date once the past cycles have been calculated.
Not every price ratio and multiple will project a future market reversal. But, just about every important cycle high and low will fall within two-three days of an important price squared in time. Your diligent study to prove this technique will pay handsome rewards.
I’ve failed miserably at understanding the examples. Not sure if it’s the format or the way it’s written but they all look like Egyptian hieroglyphs to me. Would you please rewrite them in a more human-friendly way?