Trading Articles
Smoothing The Ride With Moving Averages By Edward Donie

There are many ways to smooth out fluctuations in the movement of prices. So what’s the best? Because of the daily volatility of prices, investors use many methods to smooth out these fluctuations to analyze longer time frame trends in price movements. Two common methods are the simple moving average (SMA or MA) and the exponential moving average (EMA). Both are calculated for a variety of time frames. They can also be combined to create other indicators and signals. Which is better? We will examine two frequently used time frames, 20 days and 50 days.
SIMPLE MOVING AVERAGE
The simple moving average for a particular number of days is the sum of most recent closes for that number of days divided by those days. After the close of trading, it is updated to include today’s data and the data of the oldest day is dropped. This figure is plotted on charts to provide a smoother interpretation of the direction of prices. In the case of the 20-day simple moving average, it is calculated by adding the closing prices of the last 20 days and dividing that total by 20. The 50-day SMA is calculated by adding the closing prices of the last 50 days and dividing that total by 50.
EXPONENTIAL MOVING AVERAGE
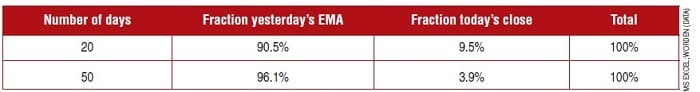
The calculation of the exponential moving average is less intuitive. It is calculated by taking a percentage of yesterday’s exponential moving average and adding a percentage of today’s close. The two fractions must total 100%. The fractions for any number of days can be found in many references. Fortunately, most charting packages include the EMA in their sets of charting tools, so all you have to do is specify the number of days or parameters you prefer. The percentages for 20- and 50-day EMAs are shown in Figure 1.
Note that the 20-day EMA uses a higher percentage of today’s close than the 50-day EMA. As with the simple moving average, the shorter time frames track changes in daily prices more closely than do the longer time frames. The choice of time frame is a personal decision consistent with your trading style and tactics.
Suggested Books and Courses About Market Indicators


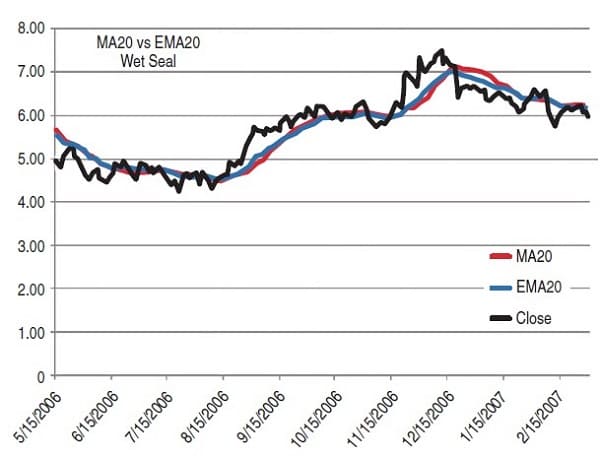
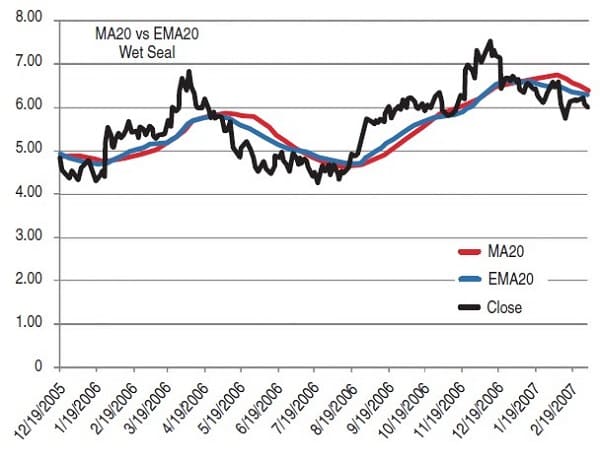
Figure 2 provides an example of the 20-day SMA and the 20-day EMA tracking the daily closing prices for Wet Seal. Figure 3 provides a similar comparison for the 50-day time frame. During periods of narrow price movements, there is little difference between SMA and EMA. During periods of broader price movements, the EMA will move more quickly in the direction of prices because it gives greater weight to more recent prices.
WHICH IS BETTER?
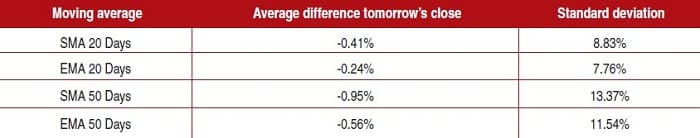
Usually, the moving averages are examined after the close of the day. What do they tell us about the closing price for tomorrow? This test was applied to stocks recently in the Russell 2000 that had at least 1,000 trading days. There were 1,508 stocks with data for some beginning as early as January 5, 1984. The data went through July 10, 2008. In all, about 5.4 million daily data items were analyzed. Figure 4 shows the average difference between today’s value of the moving average and tomorrow’s close over the entire test dataset. The differences were standardized by calculating them as a percentage of the moving average noted.
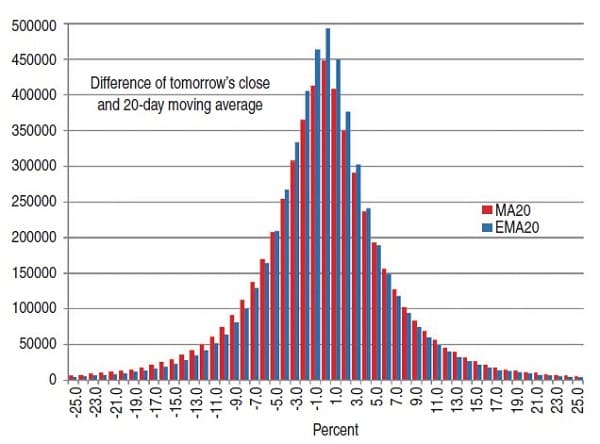
The Ema shows smaller average differences indicating a modest advantage over the Sma. The slightly lower standard deviation for Ema also shows that distribution of differences is narrower than that for the Sma. Basic statistics do not provide as clear an understanding as seeing the related distributions plotted together. Figure 5 shows the frequency of occurrences for the differences for the 20-day moving averages.
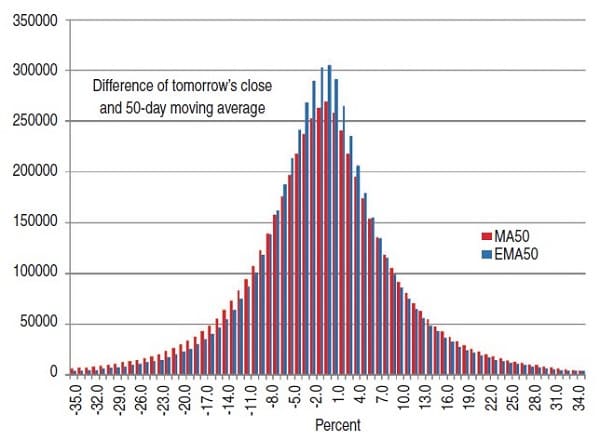
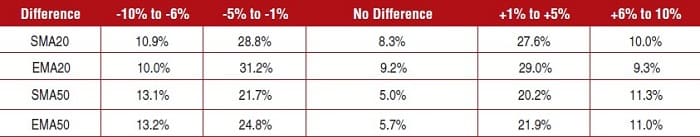
Figure 6 does the same for the 50-day moving averages. The lower and upper tails are removed for better visualization. This removed about 1% of the data from each end. Both figures show higher occurrences around zero difference for the EMAs. This further illustrates the modest advantage EMA has over SMA. Figure 7 shows the percentage of total occurrences for a few ranges to help calibrate this difference. The figures show a modestly better concentration within -5% to +5% of EMA compared with the same range for SMA.
COMPARISON CONCLUSION
The modest advantages of EMA over SMA are not dramatic enough to conclude that one is better. Experience with interpretation, application in trading methods, and personal preference are more likely to be the factors that dictate which type of moving average to use.
Edward Donie has a bachelor’s degree of science from the Massachusetts Institute of Technology, concentrating in information technology and management sciences. He works as a consultant in database technology and business intelligence.