Trading Articles
Silver Market Timing with Financial Astrology and Fibonacci Ratios
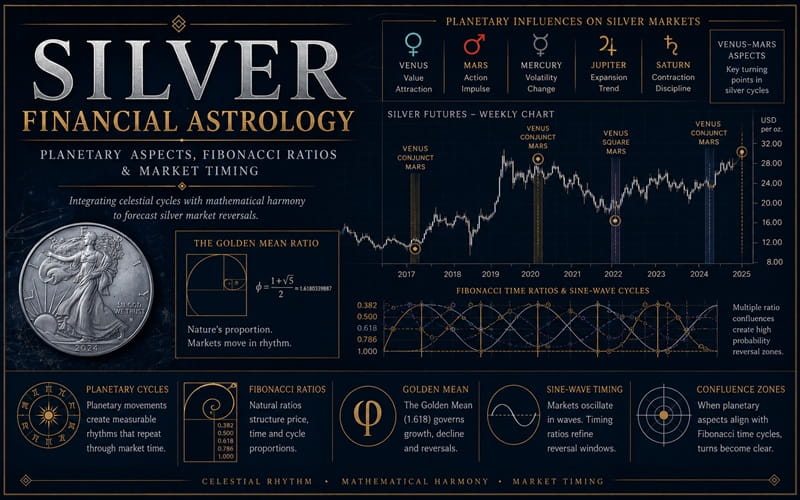
For the past twelve years I have Si the past twelve years I been researching the correlation between the price of silver and the geometric relationships of the planets. My research has proven to me that at least 80 percent of the bull and bear markets can be predicted by astronomical patterns. One of the fascinating things I’ve discovered about the movement of the planets is their perfection to mathematical order. My type of astrological based market analysis is more complex than most astrology-based systems for I incorporate certain mathematical principles with planetary relationships, specifically the Golden Mean Ratio.
Golden Mean Ratio
The Golden Mean Ratio or Phi (1.618 or 0.618) is a mathematical ratio found throughout nature, and is used by many market technicians in their predictions for future market behavior. The constant 1.618 is one of the main tools of Elliott Wave analysis, and the Fibonacci series of numbers in constantly being used for market timing (the Fibonacci series is: 1, 1, 2, 3, 5, 8, 13, 21, 34, 55, 89, 144, 233, 377, 610…). These numbers when divided into the preceding or following numbers of the sequence gives you a 1.618 or 0.618 relationship. For example, 89 divided by 55 equals 1.618, and 55 divided by 89 equals 0.618.
The 0.618 relationship can be found from the design of the Great Pyramid of Cheops to the Nautilus shell found in the depths of the ocean. The human body also has this numerical constant, for the distance across the out-stretched arms proportional to the height of the person comes to a 0.618 relationship. Therefore we must assume that this numerical relationship is a natural mathematical law of the universe and must not be ignored. The most fascinating concept of researching astronomical phenomenon is that the planetary relationships vibrate to the constant 1.618 or a number relation within the Fibonacci series. As an example of this relationship I will take the sun’s movement of 233 degrees within the zodiac (233 is a Fibonacci number).
While the sun makes this 233 degree movement, the moon has traversed the skies making approximately 8.5 lunar cycles. Breaking the complete moon cycle down to movements of 90 degrees (89 is a Fibonacci number), four 90 degree movements in one lunar cycle gives you 34; 34 times 90 equals 8.5 moon cycles (34 is a Fibonacci number). Therefore on the Fibonacci number scale you would say the sun and moon are a 233 minus 34 times 89, relationship.
Another example is the sun-Saturn quadrature relation, where every 377 days the sun and Saturn make the conjunction (377 is a Fibonacci number). Another beautiful illustration of Fibonacci harmony is the eclipse of the sun to a following eclipse of the sun. As an example: The sun’s eclipse on May 30, 1984 and the following eclipse on November 22, 1984, the difference in time being 177 days, where 2 times 89 equals 178 (89 is a Fibonacci number). This gives you one of the two major concepts of my system of analysis, for the planetary bodies make these Fibonacci numbered “sine-wave” relationships. The second phase or concept of the analysis is the actual sky concept occurring on the specific date of a high or low in the market. The combination or “systhesis” of these two phases of analysis make up the foundation of my system of dinary facts of the sine-wave analysis is that it has predicted every major top in the silver market since the 1967 start of contemporary futures trading in this market within a three day projection of time!
The sine-wave structure is amazingly accurate, and as an example of several of the steps I take in my analysis, I will use the major top of January 21, 1980 in both silver and gold. You must remember that I’m observing astronomical happenings of the Fibonacci-based sine-waves which may have little meaning to the casual glance, but influence the future behavior of the markets. I ran a test of planetary angles and sign positions in the past and future to correlate an energy vortex or web of mathematical relationships. The relationships of past and future angle formations dictate the future behavior of the markets, not necessarily the past price action.
PHASE I – The Sine-Wave Analysis of January 21, 1980.
Actual aspects of the planets rounded to the nearest degree on January 21, 1980: sun I degree Aquarius, moon 20 degrees Pisces, Mercury I degree Aquarius, Venus 7 degrees Pisces, Mars 15 degrees Virgo, Jupiter 9 degrees of Virgo, Saturn 27 degrees Virgo, Uranus 25 degrees Scorpio, Neptune 22 degrees Sagittarius.
First Test: The sun 233 degrees back in time from the target date of January 21, 1980, is May 29, 1979. Aspects: sun 7.5 degrees Gemini square Saturn 7.5 degrees Virgo. Mercury conjunct sun square Saturn, Venus/Mars near conjunction. Back 8.5 moon cycles is June 3, 1979. Aspects: sun square moon’s North node and sun square moon, Venus opposite Uranus.
Therefore, this first test sets up a Fibonacci numbered energy vortex of: sun, moon, Mercury, Venus, Saturn, Uranus and moon’s node – a tremendous energy vibration which dictates that the future mathematical point in time of January 21, 1980, would be an important change for the market.
Second Test: The sun three years and three months back in time from the target date of January 21, 1980 is 10-20-2376 (13 x 90 degrees). Vibrational aspects working in this time frame: Mars opposite Uranus, Venus opposite Jupiter, eclipse of the sun and a sign cluster of planets in fixed signs: Venus, Mars, Jupiter, Saturn and Uranus. Also, this time frame was a low in the market before a sustained rally of five months began (21 weeks). Therefore, we have another Fibonacci numbered energy vortex, reinforcing the first test’s energy points.
Third Test: The sun 4 times 377 days back from the target date of January 21, 1980 is December 10, 1975. Vibrational aspects working in this time frame: sun 135 degrees Saturn, Mercury opposite Mars, Venus opposite Uranus square Saturn, Jupiter stationary direct. Once again a tremendous energy vortex which adds to the foundation of energy points of tests one and two.
Special note: You might notice that the square aspect on May 29, 1979 between sun-Saturn at 7.5 degrees of mutable signs (Gemini-Virgo), was near the Venus-Jupiter opposition (Pisces Virgo) on January 21, 1980. This is a crossing point in Fibonacci-time of planetary bodies, which adds a further piece to our energy vortex puzzle.
Advanced Books and Courses on Astro Trading & Esoteric Methods
There are many other tests I run, but this gives you a sample of the basic concept of the sine-wave theory of time based energy points. From the examples of my testing procedure you can readily see that these points of planetary energies set up a matrix of energy vibrations in time that influence market behavior. I usually correlate as many as 36 different types of these formations to build a foundation of energy points in time which have an affect on future market action. What is even more intriguing is doing a crossing mid-point of time with aspects in the past and future to a specific point.
As an example: The Mars-Saturn sine-wave harmonic worked beautifully for the major top of January 21, 1980. I went back in time 89 weeks (23 moon cycles) and forward in time 89 weeks from the target date of January 21, 1980 (89 is a Fibonacci number). This gives you the dates of: January 3, 1978, and October 10, 1981. On May 3, 1978, Saturn was at 23 degrees–43 minutes of Leo! 24 degrees of Leo is the 144 degree of the zodiac starting with 0 degree Aries as the “0” point (144 is a Fibonacci number). This gives you a perfect Fibonacci sine-wave of Mars-Saturn crossing in time with the exact midpoint being January 21, 1980. Just one more validation of the energy points mentioned in tests one, two and three.
Special note: Another good example of a double-cross in fibbonacci based time is the major top in silver of May 21, 1968, and the major low of November 2, 1971. The distance between these two dates in time is 2 times 89 weeks. On May 21, 1968: aspects were Mars at 9 degrees Gemini and Jupiter at 28 degrees Leo. On November 2, 1971: Aspects were Mars at 28 degrees Aquarius and Jupiter at 9 degrees Sagittarius. A perfect crossing pattern of Mars opposite Jupiter, and Mars opposite Jupiter between the two dates.
Phase II – Sky Aspects
In my research I’ve noticed that Mars and Venus, taken by themselves are focal point planets for predicting many bull and bear markets in silver and gold. The angle relationship and sign position of Mars and Venus consistently correlate with trend changes. The aspects of Venus square or opposite Mars, by itself with no other planetary angle relationship, is one of the dominant movers for silver. As an example:
- Top on January 21,1980 – Venus 6 degrees to opposition to Mars.
- Top on September 21,1980 – Venus square Mars, exact.
- Top on May 14,1974 – Venus square Mars, exact.
- Top on December 31,1967 – Venus square Mars.
- Top on March 5,1984 – Venus Square Mars.
I always stress watching Venus and Mars angles and sign positions before making any decisions in trading the silver market because these angles are critical. It is also important to go to the next step in correlating the Venus-Mars dominance of market behavior by adding the elements of the slower moving outer planets. The angle and sign relationship of Venus-Uranus, Venus-Jupiter, Venus Saturn, and Mars-Uranus, Mars-Jupiter, Mars-Saturn gives you a focal point of energy. These relationships are necessary to start the up and down market action.
Examples of these relationships are:
Top on January 21, 1980 – Venus 6 degrees in opposition to Mars, Venus opposite Jupiter, Mars 6 degrees break conjunction Jupiter (a triangulation aspect between Venus-Mars-Jupiter, and very powerful). Saturn in sign vibration to Venus-Mars-Jupiter. This is a mutable sign cluster moon-Venus opposite Mars/Jupiter-Saturn. Also note the energy of the big up move is dissipating because of energy loss due to retrogradation of the outer planets.
Top September 23, 1980 – Venus square Mars approaching square-conjunct to Uranus. Sun-Saturn conjunction, sun break conjunction to Jupiter, Jupiter approach conjunction to Saturn (note, Jupiter conjunction or opposition to Saturn or Uranus usually sets up a long term vibration for silver).
As you can see this top had the correlation of most of the planets making powerful angles to each other. Also the sun-Saturn conjunction was stressed by the semi-square to Mars, a triangulation effect with the sun weakened by sign position and Saturn strong by sign position.