Trading Articles
Short-Term Trend Trading By Russell Rhoads
This basic system can be traded profitably on a short-term basis. Some of the most basic systems can be the most effective means of making money in the futures markets. In this article I will demonstrate one of the simple systems that can be traded successfully on a daily basis. There are no complex calculations to determine entry and exit points nor indicator cross-overs to determine entry and exit points. If you can add two numbers and then divide them by 2, you can do the most difficult calculation involved in this system. All this system does is some near-term price comparison, placing a stop order to keep losses in control and determining the time to exit the trade with your (hopefully) profit or loss.
MY TRADING DAY
The basic philosophy behind this system is to latch onto a trend that is in place based on the first half or so of a trading day. As many markets have gone to 24 hours a day, it’s difficult to determine exactly what entails a day of trading. I like to divide things by who is awake and trading at any given time, at least those of us who live normal lives and don’t live in Chicago and trade Tokyo hours. And because I live in Chicago, I usually designate 6:00 am Central Time (CT) to 3:00 pm CT as my trading day.
Before getting into what is involved in this system, I want to point out how little time it takes to trade on a daily basis. Basically, no more than 10 minutes a day should be spent on the setup and exit of the system. One of the benefits is that you can set it up during a midmorning coffee break and exit just as you get back from lunch. If the system works as it has in the past, and as always, past performance is not indicative of future returns, it’s not a bad payoff for 10 minutes of work each day.
THE SYSTEM
After selecting the time of the day, I compare the closing price to the high and low looking back over a certain time period. For example, this system can be used on the euro forex futures (EC). At 9:00 am CT (all times are CT from here on out), I compare the 60-minute bar close to high and low of the previous five bars. I look at the high–low range from 4:00 am to 9:00 am. Then I take the midpoint of this range and compare it to the closing price of the 9:00 am bar. If the close is greater than the midpoint you should go long, and if the close is lower than the midpoint you should go short. In the rare case the midpoint is equal to the close, you call it a day and don’t put on a trade. For charting purposes I use a 60-minute chart to determine the levels as well as the closing price. The chart examples in this article are 60-minute candlestick charts.
After entry, I place a stop 20 ticks away from the entry point or on short positions 20 ticks higher and on longs 20 ticks lower. For those not familiar with the euro forex futures, each tick is equal to $12.50. In the case of the 20-tick stop, this should limit your loss to $250 per trade. Stops are not perfect, but as the EC futures are very liquid, a small-lot trader, trading no more than a few contracts, should not experience too much slippage when using a stop market order. This stop level on the euro FX trading is a combination of what I consider a reasonable amount of money to risk losing on the trade and what has worked well with back-testing. You would also need to determine what works for you as far as stops go.
The way this system trades the euro FX futures involves holding the trade for four hours or until 1:00 pm. At 1:00 pm, unless the stop has been hit and the trade exited, you should take the trade off and call it a day.
EC system rules:
(9:00 am):
- Determine high–low range from 4:00 am CT.
- Go long if 9:00 am price > midpoint of high–low range.
- Go short if 9:00 am price is less than midpoint of high–low range.
- If long, set stop 20 ticks lower than 9:00 am price.
- If short, set stop 20 ticks higher than 9:00 am price.
1:00 pm:
- If no stop is hit, exit long or short position.
- Be sure to cancel stop orders.
Now I will show you a couple of examples of this system in action. I have included winning as well as losing trades.
EC EXAMPLE 1
The first example depicts catching a trend in midsession and riding that trend to higher prices for a few hours. Figure 1 is from January 24, 2008, and depicts where the high and low that determine the signal level are on the chart. In addition, the entry and exit, determined by time in this case, are highlighted. Although you may normally need to calculate the signal level, sometimes it is pretty obvious that the 9:00 am close is higher than the midpoint of trading over the previous five hours. Whenever in doubt, go find a calculator. However, as in this case with a nice uptrend already in place, it is apparent from just looking at the chart that going long is the correct course of action.
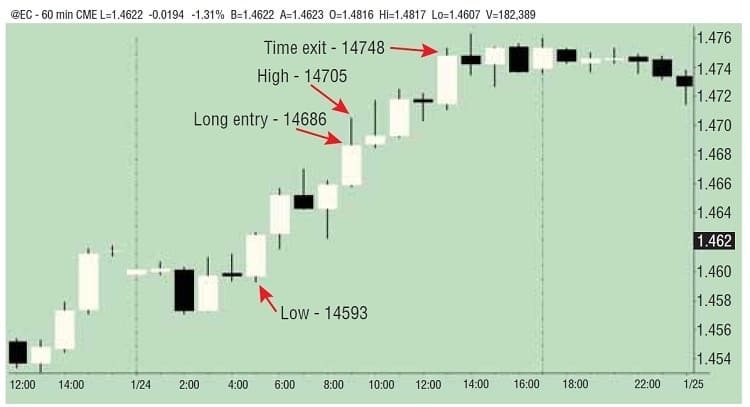
For the sake of exercise, I’ll run through the calculation process. The low of the lookback range is 14593 and the high is 14705, with the high occurring in the 9:00 am bar. Adding these two levels together and dividing by 2 gives you a midpoint signal level of 14649. The closing price of 14686 is well above this level. Your long entry is 14686 and a sell-stop loss order should be placed at 14666, 20 ticks lower than the entry.
Luckily, the stop-loss is never touched on this trade and the trend continues higher in a strong fashion. When 1:00 pm rolls around, it is time to exit and if you match the 1:00 pm 60-minute bar closing price, you would sell at 14748. Executed perfectly, this would result in a profit of 62 points (14748–14686). As the euro FX futures trade in increments of $12.50 a tick, this comes to $775 minus commissions. Not bad for 10 minutes’ work! One last note: Don’t forget to cancel your stop order. It’s been a while, but I have been a victim of not removing my stop order after exiting this trade. I may be distracted by another trade, a phone call from home, whatever. Mistakes do happen, but really try to avoid that one.
Suggested Books and Courses About Chart Patterns
EC EXAMPLE 2
All trades don’t work as well as the first example. Figure 2 depicts the system having a losing day. On February 4, 2008, the EC futures traded in a relatively tight range from 4:00 am to 9:00 am. The high over that time frame was 14822 and the low was 14791. Math would have been involved in determining the trade signal level, since the 9:00 am close was close to the middle of the range from the 4:00 am close. Added together and divided by 2, this gives me a trading signal level of 14806.5. Whenever there’s a “.5” at the end of the number, there’s going to be a signal since the EC futures don’t trade in 0.5-point increments. The closing price of the 60-minute bar is 14802, lower than the signal level of 14806.5, so a short sell was initiated.
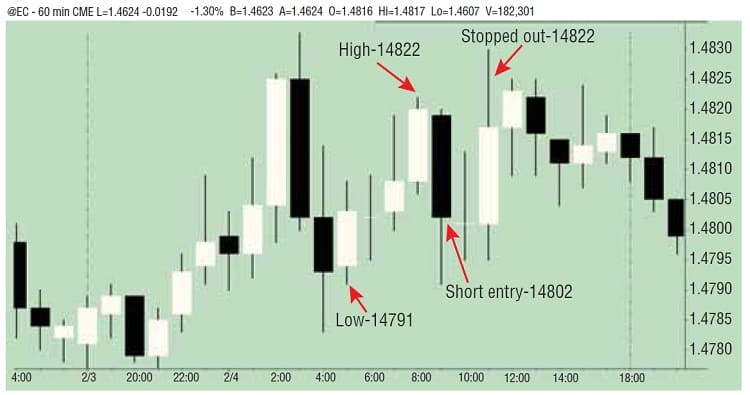
Unfortunately, in this case, the trade didn’t make it to 1:00 pm or the four-hour exit time. As the trading rules call for a stop 20 ticks away from the entry, a buy-stop was placed at 14822. The buy-stop was actually triggered less than two hours after the trade was initiated. This level is the same as the high of the range used to determine the entry signal level and just for clarity’s sake, that is just a coincidence. This is a reasonable loss of 20 ticks, and with each tick in the EC futures equaling$12.50, you have given the market $250 plus commissions.
EC BACKTEST RESULTS
As with all systems I trade, there was extensive backtesting involved in developing the system. I tested trading the EC futures in this manner from the first day of 2003 to the end of 2007 before starting to trade it live. I traded this method in 2008, and those results are also included (see Figure 3). The results show that if these rules had been followed on a daily basis and a commission of $5 a trade had been taken into account, all five of those years would have shown a profit. Monthly and annual results are displayed in the table.
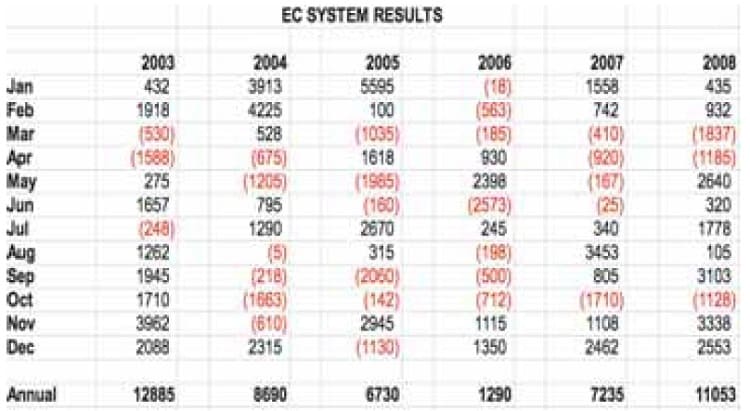
The results of trading every day with the system, like many trading plans, do take some fortitude to live through. For a four-month period in 2004 or 2007, a trader may be asking himself what he’s going through all the trouble for, but over the long haul, this method of catching a small intraday trend with the EC futures works out well.
USING THE SYSTEM ON 10-YEAR NOTE FUTURES
Another market that this system seems to work well with is the futures that trade on the US Treasury 10-year notes (TY). Like the euro FX futures, the TY futures trade electronically around the clock. While the basic approach to trading the TY futures is the same as the EC system, there’s one big difference. The entry for the TY system is determined at 10:00 am, with an exit at 2:00 pm. After testing various time periods, this worked better on a historical basis than using the 9:00 am to 1:00 pm time frame. In addition, since the TY futures and EC futures have some of the same macro fundamentals influencing them, it provides some diversification benefits by combining the two systems and following the rules for each.
TY system rules:
10:00 am:
- Determine high–low range from 5:00 am CT to 10:00 am CT.
- Go long if 10:00 am price > midpoint of high–low range.
- Go short if 10:00 am price < midpoint of high–low range.
- If long, set stop 20.0/32 lower than 10:00 am price.
- If short, set stop 20.0/32 higher than 10:00 am price.
2:00 pm:
- If no stop is hit, exit long or short position.
- Be sure to cancel stop orders.
The rules for trading the TY are: 10:00 am entry based on the price versus the range from 5:00 am to 10:00 am. If above the midpoint go long, if below the midpoint go short. Place a stop 20.0/32 away from the entry level. Exit at 2:00 pm or on a price stop.
TY EXAMPLE 1
The first actual trading example can be seen in Figure 4, which depicts the TY price action on January 11, 2008. Once again, all the key levels are highlighted on the chart. For those not familiar with trading TY futures, they are quoted in 32nds, but each tick is half of 1/32. For example, a quote of 113’12.5 would translate to 113 12.5/32 or 113.390625. Each point on a TY future is worth $1,000, so each tick is worth 0.5/32 x 1,000, or $15.625.
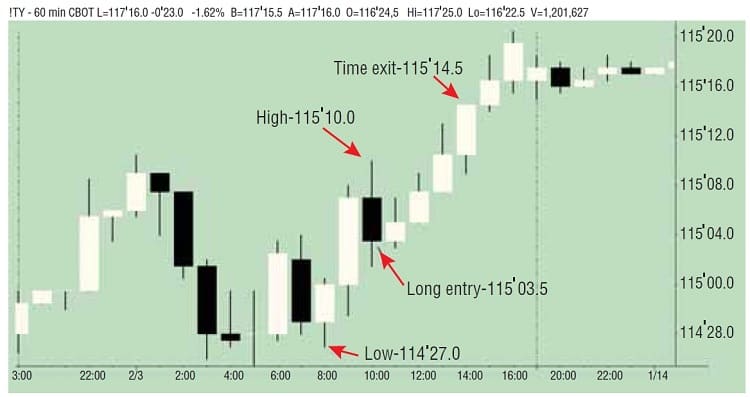
The midpoint of the high–low range in this case turns out to be 115’02.5. This was determined by the high of 115’14.5 added to the low of 114’27.0 and the sum is divided by 2. This is another instance where you would definitely want to do the math since determining whether to go long or short isn’t easy by just looking at the chart. Since the 10:00 am close is 115’03.5, a long trade is initiated. A stop is also placed.
For the TY system, the stop level that has worked well in the past is 20.0/32. Subtracting 20.0/32 from the entry level of 115’03.5 gives a sell-stop level of 114’15.5. Luckily, the price doesn’t reach this level over the next four hours. In fact, the trend really takes off just after the 10:00 am closing price. This trend continues on to the close four hours later at 2:00. This creates a time exit of 115’14.5 for a profit of 11.0/32, or in money terms, a profit of $343.75 before commissions. This is another nice profit for a few minutes’ work.
TY EXAMPLE 2
As with the EC trades, a loser should be and is included as an example. Figure 5 is of the trading action in the TY futures on January 29, 2008. The high and low of the five hours of trading leading up to the entry are highlighted on the chart. However, this is one of those cases where you can probably look at the chart and tell the closing price is closer to the low than the high of the prior trading action. As this indicates a downtrend, a short trade is entered at 116’15.0.
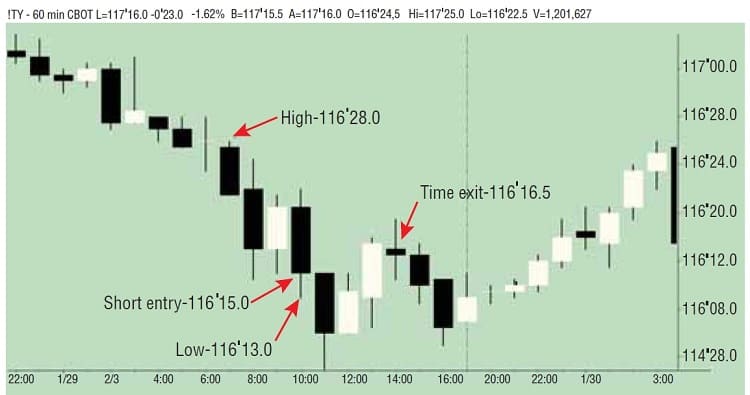
The initial move in the futures suggests that things are going to work out well, but midway through the remainder of the day, the price reverses. This reversal doesn’t result in too much of a loss. The 2:00 pm closing price is 116’16.5, resulting in a total loss of 1.5/32. In wallet terms this is a loss of $46.875 plus commissions. It’s a losing trade, but one you would probably not lose too much sleep over.
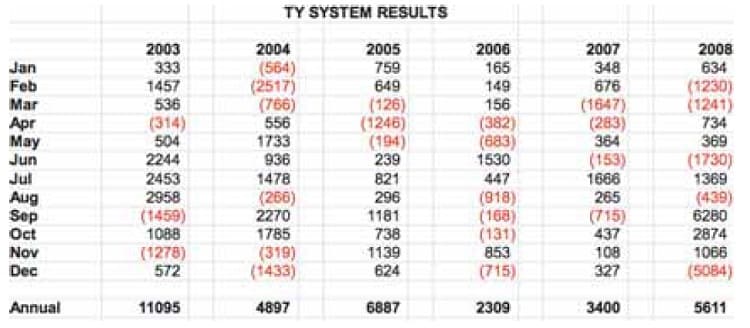
TY BACKTEST RESULTS
As with the EC system, I backtested the TY futures using this method of trading from the beginning of 2003. The results are displayed in the table in Figure 6. The system was fairly consistent and, if the rules were followed, it would have made money in all five years of testing in the backtest. In addition, I commenced trading the system at the beginning of 2008 and my results were very similar to the results depicted in Figure 6. You can see there were a few rough patches, but the system generally recovered from them fairly quickly.
BACK TO BASICS
The system as presented is very basic. However, there are several variations you can perform on this system, such as not using a price midpoint. Instead, you could decide to go long if the price is in the upper quarter of the price range or to go short if the price is in the lower quarter of the price range. Of course, this adds more to the calculation process, but nothing more than ninth-grade algebra. The example of the EC losing trade is one where a signal would not have occurred if a buffer like this were implemented.
In addition, you may set exit targets based on price in addition to the time exits. However, as a warning, I’ve found having a target generally limits some of the big afternoon moves that may occur in several markets, including both the EC and TY futures. This ends up limiting the profits that may be realized on some of the most profitable days. One other easy alteration is working with various price stops, as opposed to the stops I have included in this article. The stop-loss orders that I use are good for my personal risk tolerance, but may be too much or too little for another trader. You should base your stops on how much you are willing to lose along with how the system’s profitability is affected by changing stops. These are just a couple of the time-based trend systems I trade. They are very good representations of how a disciplined approach to short-term trend trading can result in steady long-term profits.
Russell Rhoads has more than 17 years’ analytical and trading experience in equities, options, and futures. He is an independent futures trader, financial author, and freelance programmer based in Chicago, IL. In addition, he is the author of Candlestick Charting For Dummies.