Trading Articles
Andrews Pitchfork Green Line for Exit Timing
Knowing when to exit a trade can work wonders for your trading returns. Here’s one tool that can help you make that critical decision. It was a very hot day in September and I was at a private lunch meeting with the CEO and CFO of a legal consulting company. They were making the rounds to encourage well-heeled investors to consider investing in their company. Their stock had a high market cap but a low daily turnover, which for most money managers, is a criterion that brings up a caution flag.
I decided to use the opportunity to practice presenting a small piece of what I was working on, one of the many automated techniques used by the technical analysis software that was being built for a family office consortium. I decided to present them with credible evidence that I had technology that is used by the money managers of the ultra-wealthy in Vienna to know when to sell. This may sound like a tall tale, but I taught technical analysis to Vienna money managers several years back.
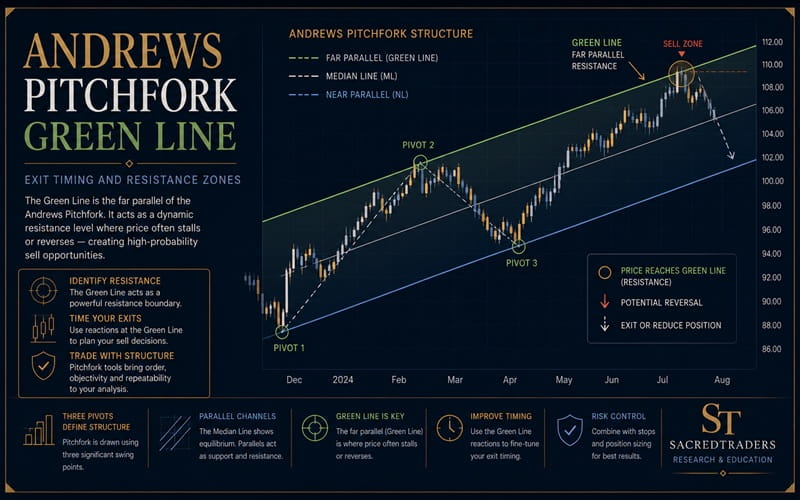
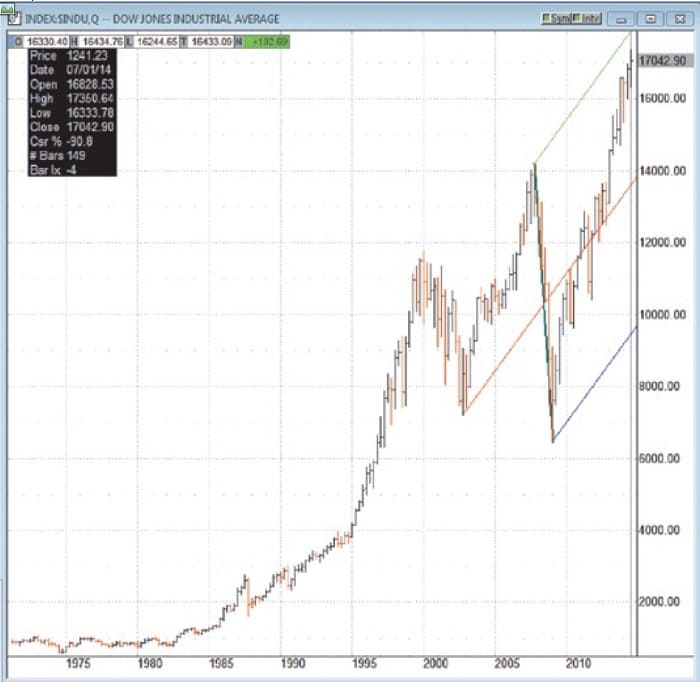
First I showed them the chart of the Dow Jones Industrial Average (DJIA) you see in Figure 1 and mentioned that a year ago I posted a video that suggested the DJIA was near a topping area. In the chart of the DJIA in Figure 1 a mega-horn pattern is in play and price is near the green line. The technician who first identified the pattern and coined the term mega horn wrote that it was more reliable for finding highs than lows. The green line is the far parallel of an Andrews pitchfork. The pitchfork is drawn using the recent three large pivots. Most charting software has the ability to draw this line. The Andrews line was originally written about in this magazine by Tom French.
Over the years I found that price often finds strong resistance at the green line. This is something I taught to money managers in Vienna years ago. Figure 2 shows the weekly scale of the DJIA and you can see that price did reverse near the green line.
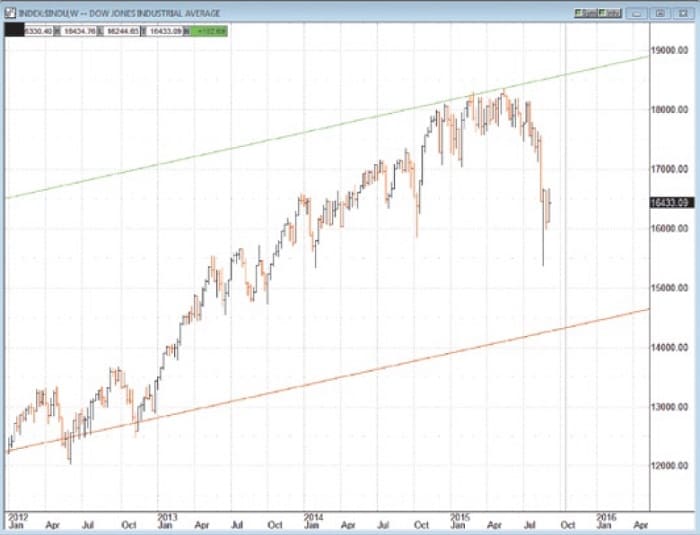
Price often finds strong resistance at the green line, which is the far parallel of an Andrews pitchfork.
Advanced Books and Courses on Technical Analysis

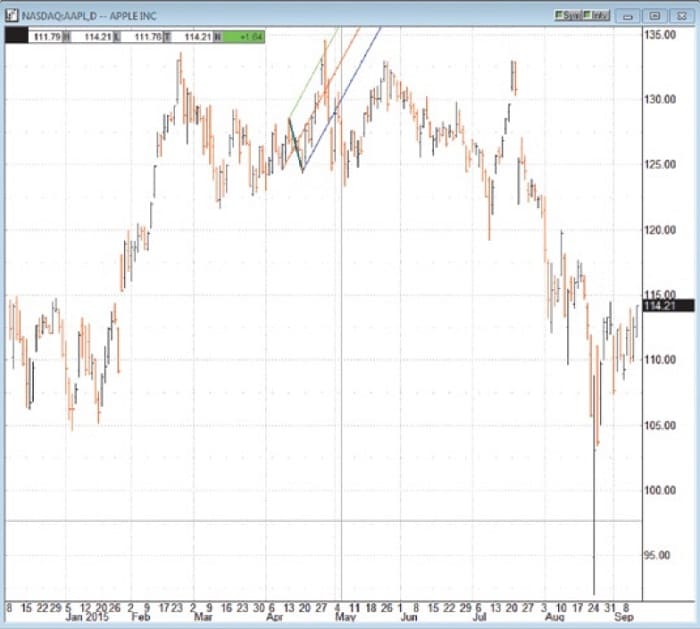
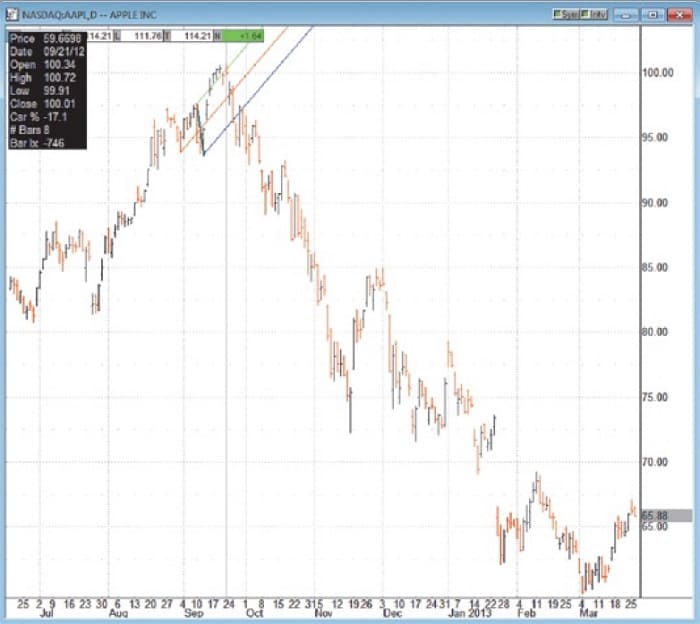
I showed them several other charts such as the daily chart of Apple Inc. (AAPL) that you see in Figure 3. Once again I pointed out that prices had made a top at the green line. Interestingly, a similar scenario took place in AAPL in 2012 (Figure 4) in that prices reversed near the green line. However, I didn’t include this chart in my presentation.
CONCLUSION
I have come across several charts that show prices reversing at the green line. I’ve seen it enough times that I am convinced the green line is a reliable tool that lets me know when to sell.
- Ron Jaenisch spent time with Dr. Alan Andrews learning his techniques. Jaenisch has been authorized by Andrews to teach the Andrews techniques via a course that now includes videos. In 2015 Jaenisch was part of an international team that built software that automatically trades forex, stocks, and futures, using the techniques.