Trading Articles
RSI Trends By Cory Mitchell
What does the behavior of the relative strength index within a trend tell you about the strength of the trend? While one common method uses divergence between the relative strength index (RSI) and price, we can go beyond that and find out if a trend is likely to continue. We can do so by looking at certain RSI levels contained in a trend; this provides us with valuable information for making trades within the current trend. Watching for breakouts of these RSI levels can also provide us with confirmation for what is happening with price.
SUPPORT AND RESISTANCE LEVELS
Just as price will show respect for support and resistance levels, RSI levels do as well. This can be an extremely valuable tool for confirming trends and possible reversals. In a bull market, the RSI (in this case, I will use the 14-day) will often be seen moving between 30–40 lows and 80–90 highs. In a bear market, it will move between 20–30 and 60–70. These key levels seem to hold in all markets regardless of the time frame. Each market seems to find its own support or resistance within the levels outlined.
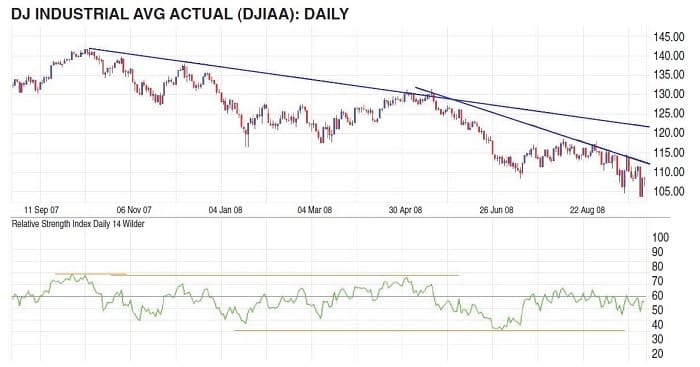
In Figure 1 we see the Dow Jones Industrial Average (DJIA) in a downtrend. The RSI at the bottom of the chart shows that the indicator only gets as high as 67 during the entire downtrend (the middle line marks the 50 level). The RSI has respected that resistance level throughout its downtrend. Near the bottom of the RSI, we see that the RSI has bottomed around the 30 level with extreme lows at 22. This is valuable information, as these levels can provide us with confirmation that this trend will continue, or the level on the RSI where it is likely to reverse.
Suggested Books and Courses About Trading With Indicators


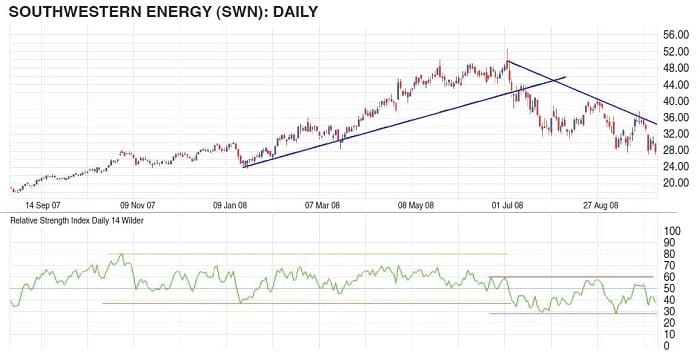
In Figure 2 is another example, this time with an uptrend and a downtrend. During the uptrend (orange lines on RSI), the RSI moves between 37 (each stock or market will have its own levels within a few points of the bear/bull levels specified) and 80. As the price accelerated upward from January through June 2008 the 40 level on the RSI was not approached, as the RSI stayed in the 50–70 range most of the time. As the price began to break down in July 2008, the RSI broke through that 37 support level and established a new range (red lines on RSI), this time at the lower levels of 27–60.
TRADING APPLICATIONS AND BENEFITS
Each stock or market will develop its own support and resistance levels on the RSI within the ranges associated with bear and bull markets. These support and resistance levels should be drawn on the RSI. When the RSI moves below its support level in an uptrend, it provides confirmation that a reversal is in effect; the uptrend is over and prices are going to head lower. When the RSI moves above its resistance level, it warns that a downtrend is completing and prices are reversing to move higher. If prices pull back (in an uptrend) or push up (during a downtrend) but fail to break the respective support and resistance levels on the RSI, it is a strong confirmation that the current trend will continue.
Using RSI support and resistance levels in accordance with the bull and bear market ranges specified will reduce the amount of false signals received by traders. It will also reduce the number of trades taken, reducing trading fees, and avoiding the whipsaws often associated with volatile markets. By not overtrading, the trader will be able to take advantage of the larger trend on any time frame, extracting more profit from it.
REAL-WORLD EXAMPLE
These RSI support and resistance levels can be used to develop an entire trading strategy for visibly trending markets. Figure 3 is an example of how this strategy could have been used to extract profits from the trends within the SWN stock. In January 2008 there is a sharp selloff where the RSI is pushed down near the 40 level. As prices begin to rise once again, you can feel confident that the down move is over and that the uptrend is resuming (this entire time we are still in the bull market range). A long entry should be taken when the RSI has moved up from the support level (37 in this case) by several points or the RSI has moved above another recent support level. In SWN, there was a former support level at 48 that held from November through January. The point at which the RSI bounces up from 37 and reaches this former support level is when an entry would be taken. This happened on January 28 — you enter near the close of that day with a price of $26.48.
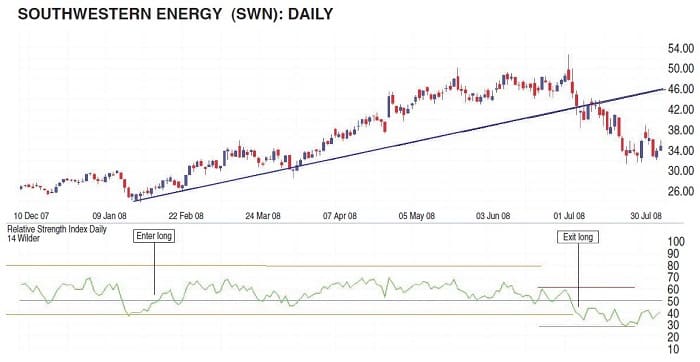
You stay in the long position until the RSI breaks below 37, signaling the uptrend is over. The RSI breaks through 37 on July 7, 2008. You then exit on the close of this day at a price of $42.51. This trade gives you a 60% return in just over six months.
USING IT EFFECTIVELY
It is important to remember that this strategy applies to trending markets. A trend can be visualized using trendlines. If the market stalls and prices begin to range, you do not need to exit positions. Your RSI level exits will be triggered when the market has moved a sufficient amount. New trades should not be taken with this strategy if no trend is present and the price is range-bound. That said, time frames can be altered to find opportunities on shorter- or longer-term trades.
Using support and resistance lines within the standard ranges for bull and bear markets can create trading signals. This method takes advantage of trends that are still sound but have experienced a short-term pullback in price. Using the ranges as a confirmation tool is also very effective and simple. It is important to note that other methods using the RSI can still be implemented, such as divergence between the RSI and price. When SWN eventually begins to fall in July 2008, the RSI reaches former levels even though the price makes a new high. This method can still be used as an early warning that something is wrong.
STRENGTH OF A TREND
Each market will develop its own trading ranges for bull and bear markets within the RSI. These levels can be used to confirm trends and validate reversals. Bull markets often range between 40 and 90 and bear markets between 20 and 70. Each market will develop its own support and resistance lines within these guidelines. You can avoid whipsaws using the range of the RSI as a confirmation and reversal tool, but keep in mind that it should only be used in trending markets. Other indicators and signals should be used in conjunction with this method so major moves are taken advantage of.
Cory Mitchell is an independent trader specializing in short- to medium-term technical strategies.