Trading Articles
Old Trendlines to Predict Future Movements By Cory Mitchell

Can you extend old trendlines into time and use them to anticipate future price movements? Trendlines are well known to most traders, but most traders don’t know all the ways trendlines can be used. Trendlines are often drawn, but when they are broken they are deleted. While a trendline does provide the function of acting as support in a downtrend or resistance in an uptrend, as well indicating a break of those trends when the trendline is broken, you can continue to extend old (broken) trendlines out into time, and they can often predict future price movements.
Drawing Trendlines
Trendlines are dynamic, and if you are going to extend them out into the future, you must make sure you draw them accurately so that future price actions are more likely to correspond with these broken lines. What you should realize is that a trend may have several trendlines, not just one. Since the market does not always move with the same aggressiveness, you may have a trend that is quite steep and another that is much flatter. For this reason you should draw trendlines based on normalized movement, as well as lines that correspond to irregular movements or spikes.
A normalized trendline allows you to connect multiple tops and bottoms, possibly by passing through an extreme high or low instead of passing right along the top (down-trend) or bottom (uptrend) of that spike. You should also draw a trendline using the extreme high or low of a price spike. Often, spikes will connect with future spikes. This is why in real time you draw a normalized and spike trendline. If price action passes through your normalized trendline, it is likely to move to your spike trendline. Beyond this, the price action is likely to move to other trendlines.
You should draw trendlines wherever you can connect three or more points (highs or lows) on your chart; these points should be in relatively close proximity to the trend-line, although only two actually need to be touching the line. Once you have drawn trend-lines, extend them out in time beyond the current price action and then leave them on the chart. There may be many trendlines or few, but all these lines have the potential to tell you where prices are likely to go in the future.
Future Trendline Reaction
All trendlines will be broken at some point. This does not mean they are obsolete; future prices will still react to former trendlines. The dynamics that created the original trend are often still prevalent in the future. Some guidelines to keep in mind are:
- An old support trendline will act as resistance when the trend reverses.
- An old resistance trendline will act as support when a trend reverses.
- Having multiple trendlines will allow for traditional trendline breakout signals, but with multiple trend-lines, you have an idea where the breakout will stall — at the next trendline.
- Where trendlines cross (one up, and one down) will often be a significant point in time.
Using Broken Trendlines
First, let us look at an example of how this process works. From Figure 1 you can see the trendline begin at a swing high and connect to a spike high in the middle of the chart. I mentioned earlier that spike highs will often connect with future spikes. This happened on June 24, 2009, where a spike touched the trendline and then retreated. To keep this example simple, only the “spike trendline” is shown, but we could also draw a normalized trendline on this chart (this trendline would have been useful on the bar before the trendline is touched for the third time).
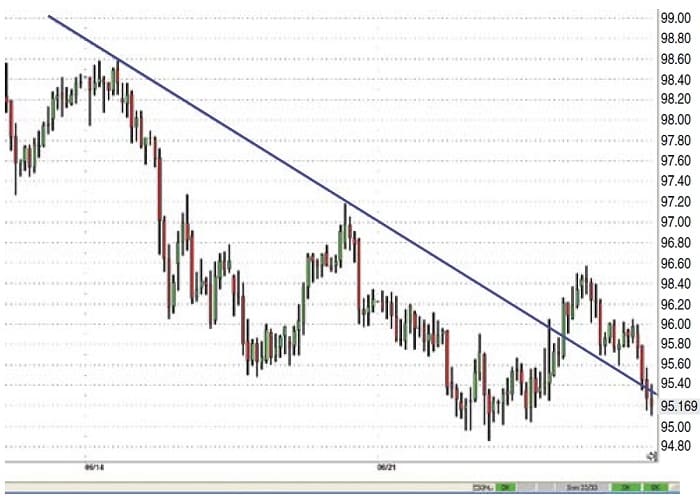
Later on June 24, you can see that the trendline was broken as prices charted higher. Many traders would trade this signal and then delete the trendline from their chart. But it still served a valuable purpose, even though it was broken. On June 25, it provided almost exact support on three different price candles. So this gives you an idea of how to use broken trendlines.
Trendlines can help determine where prices might bounce off of in the future, even if the trendline is broken or old.
Now look at a chart that contains more trendlines and thus provides you with more potential price targets (Figure 2). To avoid making this chart too busy, I did not draw all trendlines. If all lines were drawn, you would see even more reactions to old trendlines. The first thing to note is that you do not need to wait for the downward trendline to be broken before drawing an upward-sloping trendline. You can see how effective this original upward trendline is. It was broken on June 9 and no longer provides support, but as prices rise once again, it does provide resistance on several occasions.
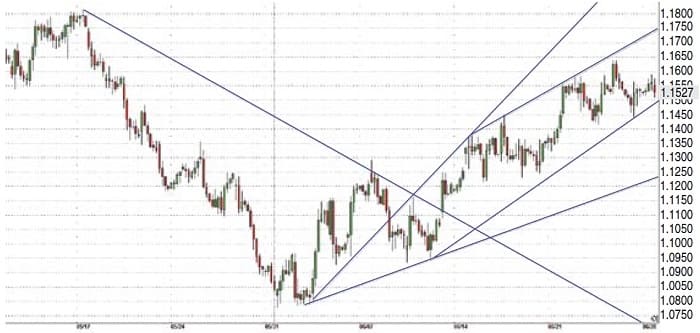
There are three additional trendlines on the chart. These trendlines can be used for future price action in the same way as the previous example. In this chart, prices are contained by two converging trendlines. If the price moves out of that range, it is likely to move to the outer trendlines that are displayed on the chart.
Suggested Books and Courses About Trend Trading


Things To Consider
Some trendlines will become obsolete, and not all trendlines will be touched again with precision by future price movement. Therefore, to keep your charts clean you should delete trendlines that are angled in such a way that they are unlikely to affect prices over the time frame you are looking at. In Figure 2, you can see that the downward trendline is unlikely to have an effect on prices in the near term, and so you can delete it.
Using multiple old and new trendlines can provide you with many uses, including alternative stop levels, profit targets, or entry points. Combining this approach with other trading methods can be very powerful. While no single method is flawless, using this approach can allow you to better see how the market is likely to unfold.
Old Trendlines For Forecasting
Trendlines are important and can help determine where prices might bounce off of in the future, even if the trendline is broken or old. By keeping multiple trendlines on your chart, you can gauge where breakouts are likely to move to. Old trendline resistance often becomes support, and support trendlines often become resistance. You should keep trendlines on your charts until it becomes highly unlikely that line will be touched in the near term. At that point it can be deleted.
Cory Mitchell, is an independent trader specializing in short- to medium-term technical strategies. He is the founder of vantagepointtrading.com, a website dedicated to free trader education and discussion.