Trading Articles
MACD And Trendlines By Danish Kapur

Using the moving average convergence/divergence together with trendlines helps to filter out false signals. The moving average convergence/divergence (MACD) (12, 26, 9) is powerful when it comes to indicating buy and sell signals. After having applied it to my trading for quite a while, I realized that the major problem with MACD was that often, the signals turn out to be false. For example, in Figure 1, the Indian rupee/US dollar (INR/USD), the MACD gave a signal to buy the dollar against the rupee in the second quarter of 2007 (May 2007) when the INR was trading at INR/USD 40.50/1.00. But the signal turned out to be a false one and INR actually strengthened to INR/USD 39.00/1.00. Also noteworthy is how even after one year (May 2008), INR/USD was trading at the same level.
The same thing happened in the second quarter of 2009 when the MACD gave a signal to buy the US dollar against rupee (INR/USD 46.5/1), but that too turned out to be a short-term bounce and the rupee started strengthening after initial weakness to INR/USD 49.00/1.00. As you can see, it is now trading at INR/USD 44.5/1.
DIVERGENCE 1
I prefer to use the MACD to look for divergences, as MACD together with trendlines really helps in filtering out false signals. In Figure 1, you can see that in second-quarter 2007, the Indian rupee kept making lower lows and lower highs, but MACD was moving in the opposite direction, making higher lows and higher highs (displayed as “divergence 1”). This is considered to be a bullish divergence, and you should think of it as a warning for a trend change. I would not take any action on just this divergence but wait for price to cross the downsloping trendline (shown as “trendline 1”) to reverse my position (that is, sell the rupee to buy the dollar).
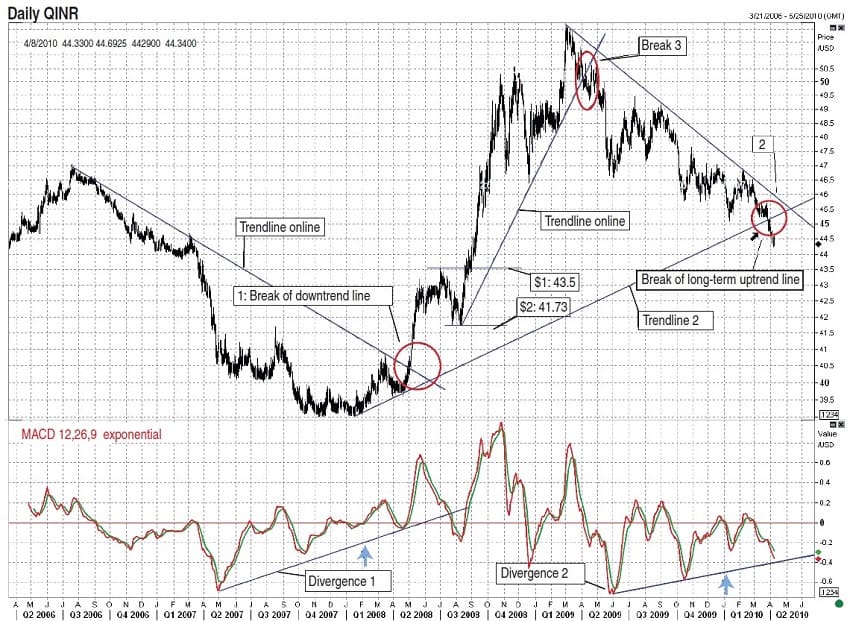
This happened in the second quarter of 2008 (May 2008, with the circle labeled “One: break of downtrend lline”). It took nearly one year for the trend to change, given that the divergence in the MACD started in May 2007. So even though MACD is good at indicating divergences, it could be a while before you see a change in trend. This is why I consider trendlines and MACD together to be a useful combination.
Suggested Books and Courses About Market Indicators


Had I been using only the MACD, I would have sold the rupee against the dollar too early. But about one year later when price broke the downsloping trendline, I opened a short position at a similar price as that of May 2007. So it saved me about a year, not to mention the endless frustrations during that one-year time period, assuming I didn’t get stopped out.
DIVERGENCE 2
Another example can be seen in thefirst quarter of 2009. The rupee weakened to INR/USD 50.50/1.00 during fourth-quarter 2008 (December 2008) and then strengthened to INR/USD 46.50/1.00 (January 2009). When INR weakened again to levels lower than INR/USD 51.00/1.00 (March 2009), the MACD didn’t follow, instead diverging as can be seen (March 2009 MACD top lower than November 2008 MACD top). This was a warning that a trend change was near, but I would look for confirmation in the form of a trendline break, which happened later in April 2009 (“break 3”)..
DIVERGENCE 3
We are again faced with a similar situation with the rupee strengthening against the dollar, making lower highs and lower lows, but MACD making higher lows (seen on the chart as “divergence 2”). This can be a warning that a trend change is near, but I would wait for a break in the downsloping trendline labeled “2.” In addition, note that the long-term uptrend line (“trendline 2”) has been broken and this can lead to further strengthening of the rupee. There is a chance that INR will strengthen up to the area between S1 and S2 (INR/USD 43.50/41.73). If you were to look at a longer-term chart of the INR/USD, you would see that this area is significant in terms of providing support and resistance.
These three examples show how combining MACD with trendlines will result in stronger and more reliable signals. More important, you can save yourself a lot of frustration given that you can enter and exit your positions in a more timely manner.
Danish Kapur is a trader, author, and commentator.