Trading Articles
Head and Shoulders By Alexander Sabodin
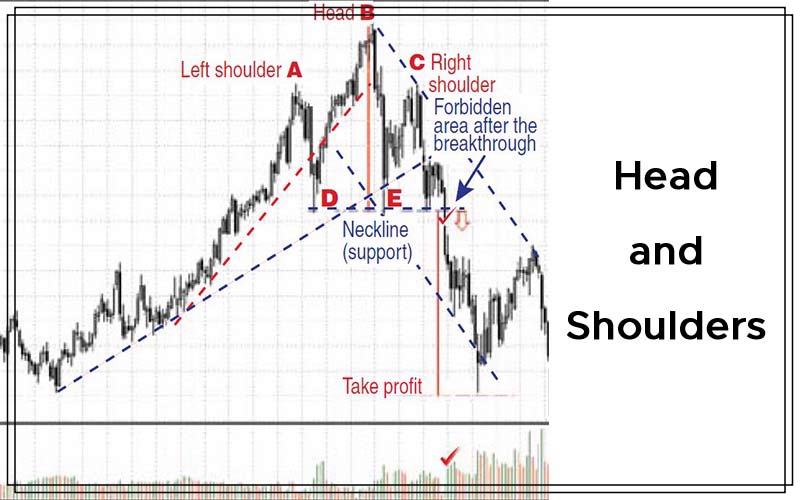
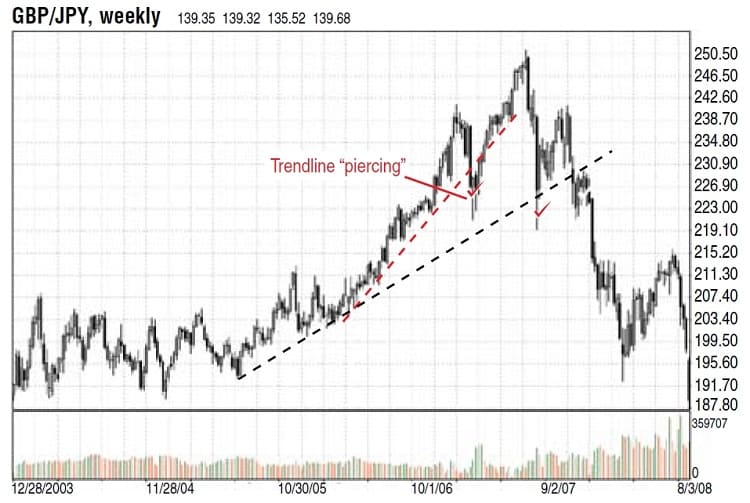
Here’s a look at a familiar reversal pattern, the head & shoulders pattern. In this installment of the price model series, we will look at a well-known trend reversal model, the head & shoulders pattern. The condition for the formation of a head & shoulders pattern is an ascending movement on a price chart, when every rise and fall is higher than the previous one. In Figure 1, you can see that at a certain stage in its development, the trend has accelerated. This is shown by the second trendline, which is steeper than the original. But sooner or later all good things end. The preliminary signal of the trend slowing down occurs when price pierces both trendlines.
The breaking of the trendline does not necessarily mean that there will be a reversal in the trend. Instead, consider it a signal to close all long positions you bought at a bargain and not open any new positions. It is like catching a cold but you know you will recover soon. However, you do need to be prepared if the situation gets worse.
If the price overcomes the previous high, it means that the trend has recovered and the ascending trend has regained its strength. But if the price moves upward again after the downward correction but its high is lower than the previous high, it is a strong indicator of an oncoming reversal (Figure 2).
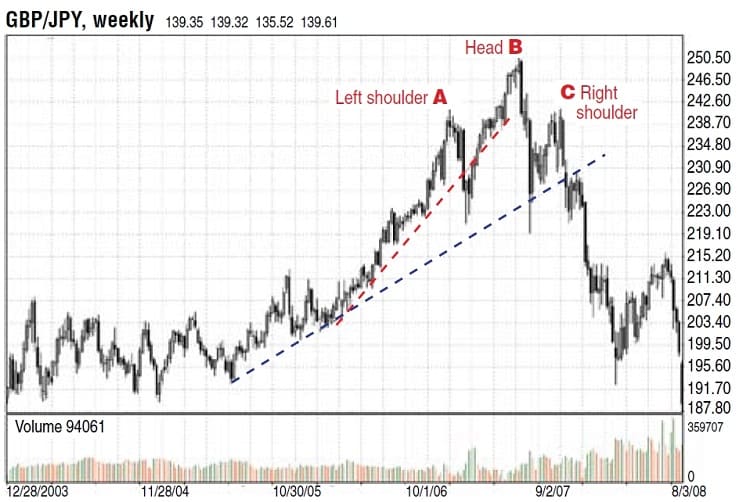
The next formation is apparent. It resembles the formation of the head (the highest maximum) and shoulders (maximum left and right from the highest one). The ratio between the right and left shoulder is not important. The main point is that the head should be higher than the shoulders. If you consider this situation logically, the formation of the right shoulder means an unfortunate attempt of the bulls to continue the ascending movement. In this case, a popular soccer saying would work: “If you do not score a goal, a goal is scored to you.”
Although new technical methods and innovations appear both in science and trading, human psychology remains the same as it was 100 years ago.
Suggested Books and Courses About Chart Patterns


Once the right shoulder has formed, price forms a support level that you can mark through the last two minimums, points D and E. The head rests on this support level, which is the neckline (Figure 3). When price breaks through the neckline, you get a sell signal. To avoid making a hasty decision, it is always a good idea to look for opportunities to sell after the candlestick bar closes below the neckline. By the time you get the signal, you already have conditions for the formation of the descending trend — that is, two successive descending maximums — the model head (point B) and its right shoulder (point C), through which you can draw a trendline. You can then draw a channel line parallel to the descending trendline through point E.
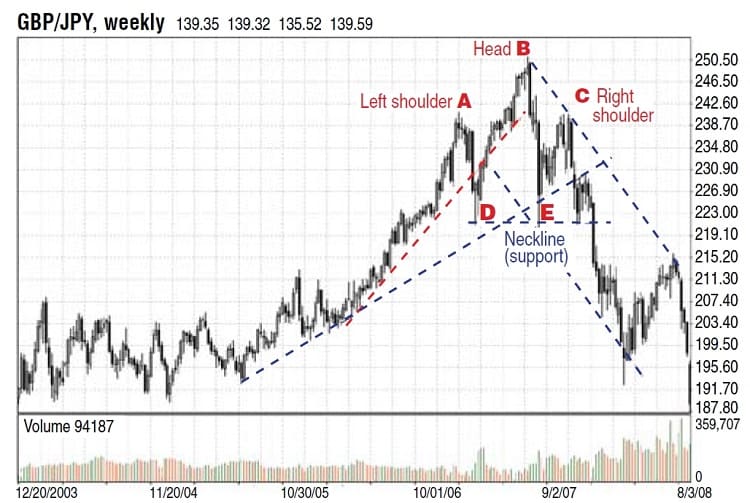
The classic method for defining the target is to draw a vertical line from the head to the neck (Figure 4). I need to mention one more variable, and that is that volume should rise when the model is broken through. This proves the true signal, since the pressure on price from the bears’ side is higher than from that of the bulls (these areas are checked in Figure 4). Note that volume should not be considered as the absolute value but more so as a relative one. But at the same time, volume does not have to be the highest one for the entire period that the financial asset has been in existence.
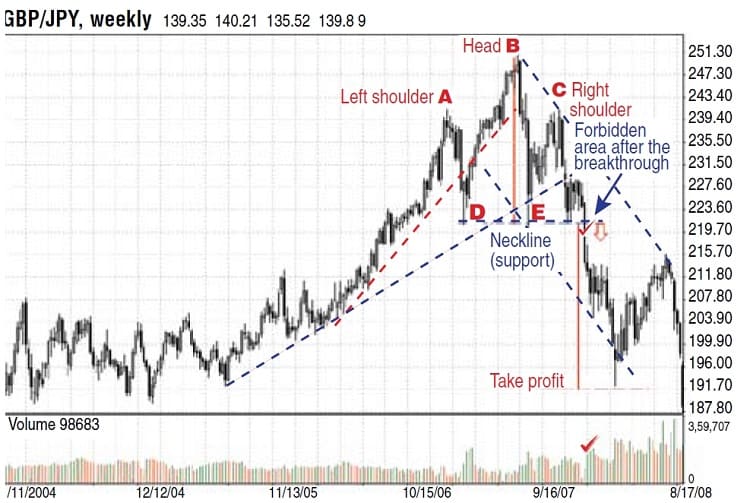
After price moves above the neckline, it enters the “forbidden area.” So in order to not fall for the false signals, it is a good idea to make conclusions only after the closing price of the candle body (not taking shadows into consideration). If price returns into the formation at the close, you may want to think twice about closing your position, since there is a strong chance of a false breakthrough. However, if price returns to the neckline, it can be considered an advantage because you could open a new position with the trend, which could be profitable.
Some Indirect Signs
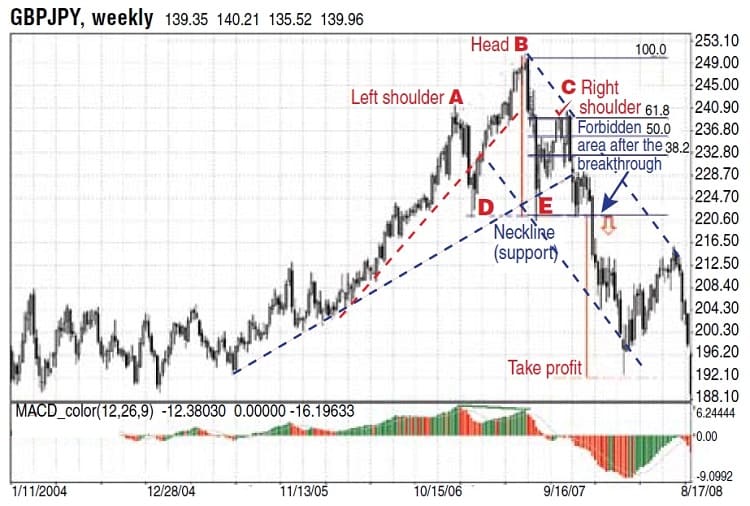
Some other indirect signs of the head & shoulders formation prove its significance. First is the divergence between price and oscillators when the head of the pattern has formed. This indicates that prices are likely to move lower in the near future. Note how price sets a higher high, but the moving average convergence/divergence (macd) histogram sets a lower high against the previous high in Figure 5. Second, note how the formation looks harmonious when the right shoulder reaches the Fibonacci correction level of 61.8.
In addition, the time interval within which the price model is formed is important. The larger the time interval, the more seriously a signal should be treated. The strength of the model in smaller time intervals, however, may be doubtful. I would not recommend using the head & shoulders formation in a time scale less than an hourly one. The head & shoulders model that emerges after a downtrend is referred to as “inverted.” In its core, it is the mirror of the model I have just discussed. The working rules with it are the same.
Human Behavior Doesn’t Change
Although new technical methods and innovations in technology appear both in science and trading, human psychology remains the same as it was 100 years ago. Fear and greed, hope and euphoria still prevail in the market. And as price models such as the head & shoulders pattern reflect mass psychology (which remains unchanged over time), we must consider them to be powerful tools for analysis and prediction of the future development of a situation in any mass financial market.
Alexander Sabodin is a private trader and analyst for the forex currency market.