Trading Articles
Gold And Candlesticks By Gary Wagner
You can profit in gold as long as you keep a careful eye on the chart. The market technician uses a chart like a road map, using mathematical indicators like signs along the road. The more complete the map, the better you are able to navigate through any given stock or commodity. The most common types of maps are bar and candlestick charts. Both display open, high, low, and close. Both can be overlaid with western technical indicators. But only the candlestick chart will display this price action by visually presenting the battle between the bulls and the bears, and display the information of a single session to point at a change in the road ahead.
INTRODUCTION
The technician using the candlestick method regards each trading session as a battle between the bulls and the bears. The outcome of this battle can be described as a single candlestick. The classic interpretation of that candle will give you information on the market sentiment behind it. Take, for example, the hammer (Figure 1A). The hammer formation is noteworthy when it occurs during a downtrend. When found after a selloff, it can signal a market bottom. That the market can rally and close so far from the low is what gives this candle its significance.
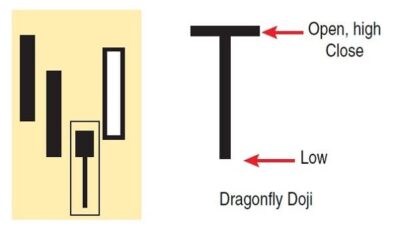
The force of a hammer depends on where it is found. If a hammer is created near support levels, then the probability of a bullish reversal is high. In perfect conditions, we would want the wick length to be several times longer than the body. The longer the candle (the larger the range), the more buyers are able to push the price back up, and the stronger the signal. The hammer resembles the dragonfly doji. In the dragonfly doji (Figure 1B), the high, open, and closing prices are identical, whereas in the hammer the open and close are close together and at or near the high.
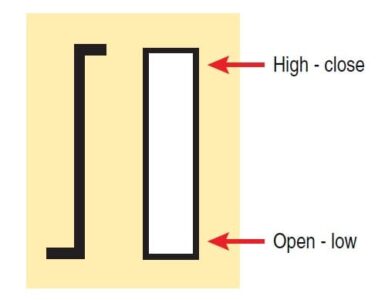
Another such bullish candle candlestick is called a white marubozu (Figure 2). This is a single candlestick characterized with a long white body having no wick on either end. This candle has an opening price equal to the low price of the session and a closing price equal to the high price of the session. The bulls controlled the price action from the first price to the last price. The session opens at the low and price continues to improve and move up for the entire session. The bulls were able to prevail during this trading session and were powerful enough to close the sessions on its high.
When viewed in the context of the prior price action, we can obtain much information from this candle type. If the market is in a defined uptrend, it can signal a continuation of the trend. In a market downtrend, it can signal a reversal as the component of a larger candlestick pattern. This type of information is simply not mentioned on a bar chart. Insight that can be found in a candlestick chart is not as easily identifiable in a bar chart. When candlesticks are added to traditional western charting methods, you are given a more detailed picture or road map to future pricing and market moves.
CANDLESTICKS AND GOLD
Last year, we witnessed gold moving to new historic highs. As of this writing, during Thanksgiving 2009, gold closed just shy of $1,180 per ounce. It would not surprise me to see it move much higher. Some credit this historic rise to the historic fall of the US dollar. Figure 3 is a composite of a monthly gold and US dollar chart. There is a critical relationship between gold and the US dollar; they move opposite to each other and have done so for the better part of this decade. As of this writing, however, gold is at a record high and the US dollar is just short of its record low.
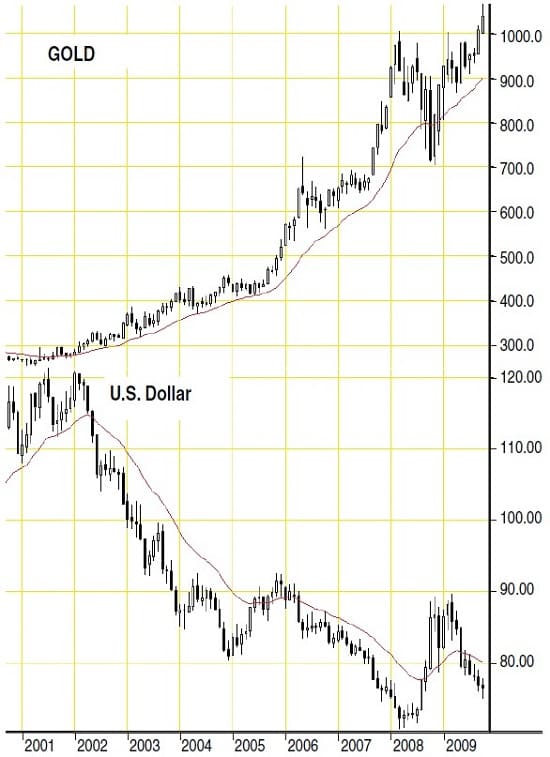
As long as the dollar remains under pressure, $1,500/oz. for gold is not impossible.
Figure 4 is a weekly gold chart. A bullish harami (A) formed during the week of December 7, 2007, and gold was trading at a low of $777 per ounce. Also called an inside day, the bullish harami pattern is a two-session pattern created from a small white real body contained within a prior relatively long black real body. If the pattern is confirmed (a white candle follows the pattern with a higher high and a higher low), it is known as a “three inside up.” Gold would make its first run ever to more than $1,000 an ounce. The culmination of this run would take gold to $1,014 during the week of March 21, 2008. An engulfing bearish pattern signaled the top (E). Gold would give back some of its gains, retracing to a low of $813 per ounce during the week of May 2, 2008. This is when the first of two “three inside up” patterns were created (B). The second occurrence was seen five weeks later on June 13, 2008.
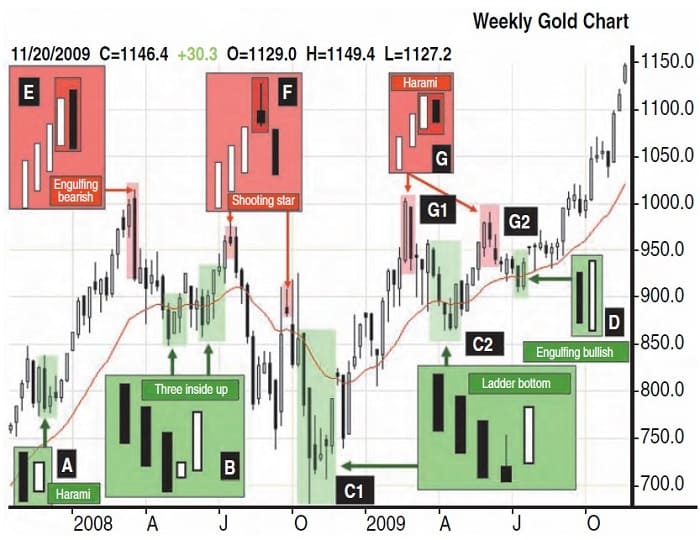
The bulls would attempt once again to take gold to the $1,000 benchmark. A shooting star would signal the pinnacle of this run (F). On July 18, gold reached a high of $986, falling just short of $1,000 per ounce. The shooting star is a small real body with a long upper shadow, which gaps higher than the real body. To create this candle the market must open near its low, and then prices must rally strongly before moving down to close near the opening price. The rally of this session could not be continued.
THE LADDER BOTTOM
Gold fell until the end of October 2008, reaching a low of $681 per ounce. A “ladder bottom” was created from the prior six weeks (six candles). In Figure 4, at C1, you see the first of two occurrences of this pattern. A typical ladder bottom is created from five candles. The first three long black candles establish an unfailing downtrend. As time progresses, bears take the opportunity to take profit. This is expressed as the fourth candle, a black inverted hammer. As the price is bid up, the high is pushed up. But in this formation, sellers are still able to drive price down to levels nearer the open, creating a small body. Up to the fourth candle, it only suggests that sellers are losing firm control of the market, not a reversal. By the fifth candle, a bullish rally creates the long white candle.
Suggested Books and Courses About Candlestick Trading
The area labeled C1 in Figure 4 is a variation of the ladder bottom. In a pure ladder bottom you get three long black candles followed with a black inverted hammer, followed by a large white candle. In this example you get a small white inverted hammer rather than a black inverted hammer and then a black hammer before the larger white candle. This would suggest that the sellers were losing control but it took two weeks (candles) to do so. This hammer has a very long tail. The longer the tail, the more buyers were able to drive price back up and the stronger the bullish signal. Gold would trade from this low of $681 to a climb above $1,000.
The market technician uses a chart like a road map, using indicators like signs along the road.
On February 2, 2009 (G1), gold hits a high of $1,004. A bearish harami marks this top. We would see another harami form (G2) on June 25, 2009. The market sees the second ladder bottom (c2). This ladder would be composed of five candles, or weeks. This pattern would signal the bottom and mark the final low before climbing to record and historical highs. With only a small retracement (D), the market heads to higher grounds without looking back.
SCOUTING PARTY
In Steve Nison’s book Japanese Candle Charting Techniques, he coined the term “scouting party” for a particular chart pattern. According to his definition, these scouting parties are sent in by big traders, commercial accounts, or even locals to test the resolve of the opposing troops. For example, the bulls will try to move prices above resistance. According to Nison, in this type of battle the bulls will have to analyze the fortitude of the bears. If the bullish scouting party can set up camp in the bears’ home field — that is, above the resistance — then a “beach head” is formed.
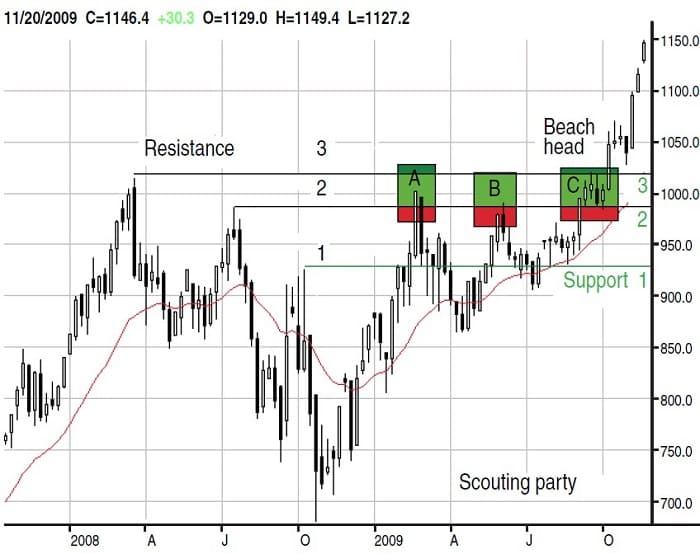
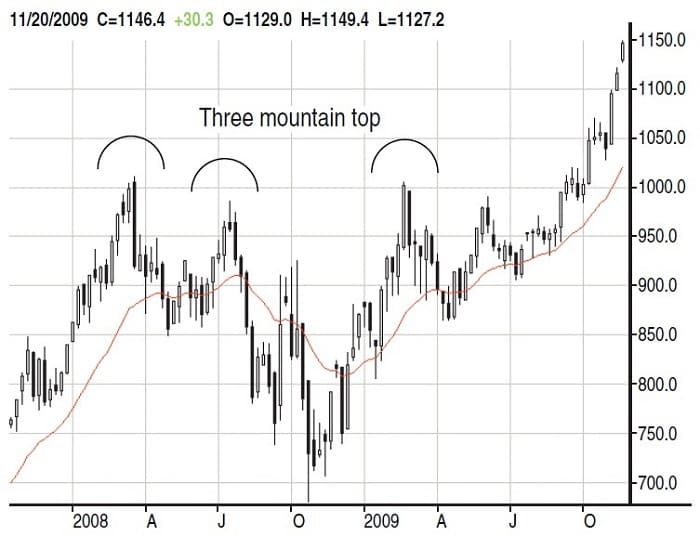
Figure 5 shows three scouting parties, both in defeat and victory. The $1,000 area was a major resistance level for gold. In the first part of 2008, on the week of March 21, the bulls were able to push gold above $1,000 (resistance line 3) to a high of $1,014, which then became resistance. The bulls made another attempt to reach and breach $1,000 only to be stopped short at $986 (resistance line 2). These two resistance lines would become the benchmark the bulls would need to break to take the markets to historical record highs. They are also the first two mountains of a three-mountain top pattern (Figure 6).
In Figure 5, points A, B, and C are those three scouting parties. It would take three attempts or battles before the bulls were able to form a beach head at $1,000 per ounce. The first attempt occurred in the middle of February 2009 (Figure 5, point A). The first weekly candle closes above $1,000 with a high of $1,004 an ounce. The following week gold opens at $996 to close at $941.50. Clearly, the bulls were unable to hold this critical level. A second attempt is made during the first part of June 2009 (Figure 5, point B). During this attempt, $990 was as high as the market and the scouting party fell short of breaking resistance (R3) at $1,000, but they were able to break resistance line 2.
On October 2, 2009, history was about to be changed and was rewritten. Opening at $993 that week, gold was able to hold and close at $1,003 on that Friday. The following week, gold opened at $1,004 and closed at $1,047. A beach head formed over the next three weeks and then the price of gold traded in uncharted territory. Trading just below $1,180 per ounce by November 26, 2009, gold certainly took many traders by surprise. Where will this uptrend end? Only the future knows. As Paul Volcker once said of a bull stock market, “Trees don’t grow to the sky, they never have and never will.” I am sure we will see many retracements even if the price of gold continues higher.
As long as the dollar remains under pressure, I believe that $1,500 an ounce for gold is not out of the realm for possibilities. Over the long term, over the next five years, I believe $2,000 is a very possible benchmark. There is one thing I am sure of: The chart is our road map, and the indicators are the signs we must follow. The more complete the map, the more detailed the signs, and the better you will able to navigate and profit in gold.
Gary S. Wagner has been a technical market analyst for more than 25 years. Wagner also codeveloped software applications for market forecasting.