Trading Articles
The Gann Method by Curtis M. Arnold: Geometry and Forecasting Structure
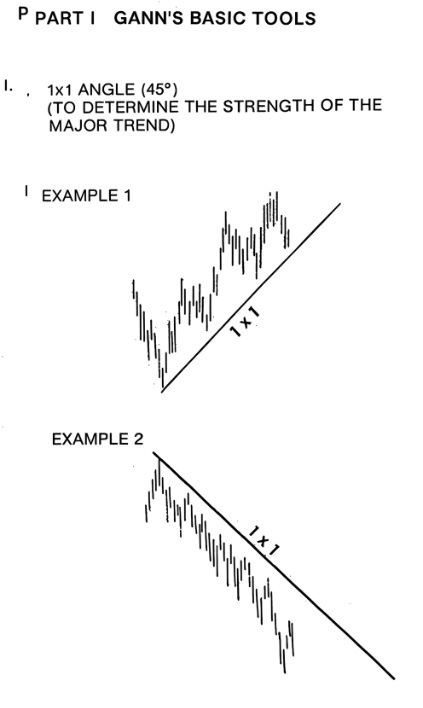
The system I am going to demonstrate is based on some of W.D. Gann’s works. For those of you who are not familiar with Gann, he was a legendary stock and commodity trader who purportedly made over 50 million dollars in the markets using his unique mathematical trading techniques. The trading method I have developed is based on two of Gann’s most basic tools—his 1×1 or 45 degree angle and his trend line indicator. Refer to examples 1 and 2.
Angles can be used to determine the strength of the market from a previous top or bottom. The 45 degree angle or 1×1 as Gann called it, is the most important angle because it divides space and time into equal parts. As long as the market stays above the 45 degree angle drawn from a previous bottom, it is in a strong position and indicates higher prices. Likewise, as long as the market remains below the 45 degree angle drawn from a previous top, it’s in a weak position and indicates lower prices. Question: How do you know when a top or bottom has been made from which you can draw your 45 degree angle? This is where the trend line indicator comes into play. Refer to Trend line indicator, examples 1 and 2.
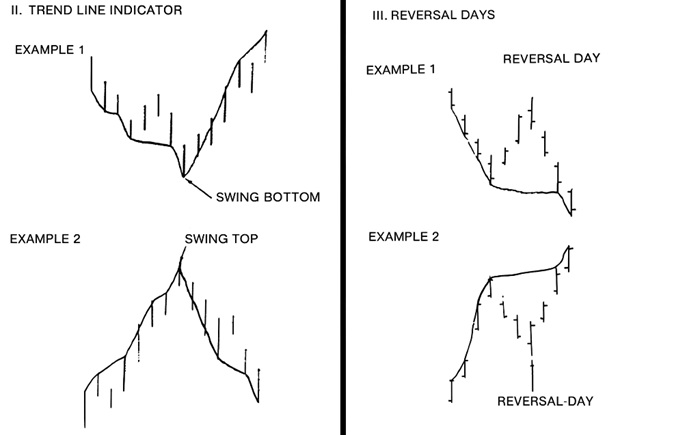
If a market is moving down, the trend line indicator is drawn so as to connect each new low. The trend line indicator does not move up until there has been three days of higher highs. At that point a swing bottom has been formed. A swing top is formed when the market has been advancing and then makes lower lows for three days. The only exception to this rule occurs when the third day happens to be a reversal day. Since a reversal day augers strongly for a change in trend we must wait to see the action of the fourth day before confirming that a swing top or swing bottom has occurred. Refer to reversal days, examples 1 and 2.
A reversal day top occurs when prices move higher but then close near the lows of the day, usually below their opening and below the midpoint of the day’s range. An even stronger reversal is indicated if the close is below yesterday’s close. Example 1 shows a reversal day top. Notice how the trend line indicator did not move up even though we had 3 days of higher prices. In example 2, we have the opposite situation, a reversal day bottom.
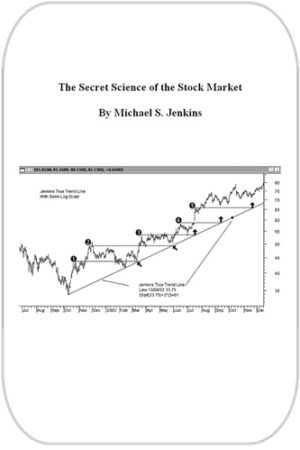
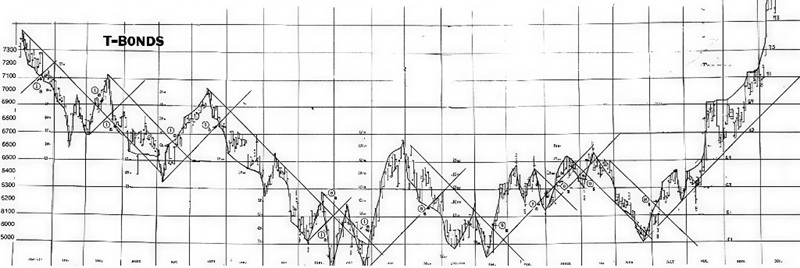
Now, if you will refer to the chart on T-bonds The basic rules of this system are to go short on a close below the 1×1 from a previous swing bottom. This occurred on January 22 (Trade No. 1). Now we draw a 1×1 down from the swing top. We stay short until we get a close significantly breaking this 1×1. You can see that occurred about March 12 (Trade No. 2) and we were forced to buy. At this time, we drew in our 1×1 from the previous swing bottom. Unfortunately we were whipsawed here and forced to sell again on March 23, (Trade No.3) incurring a loss. We stayed with this trade until May 18 when we took a profit and reversed to the long side (Trade No. 4).
Advanced Books and Courses on W.D. Gann Methods


On June 25 we reversed our position and went short again (Trade No. 5), taking a small profit. This turned out to be a great trade and gave us a profit of more than 5 full points before being stopped out on Sept. 21. (Trade No. 6) We went long here only to get forced to the short side again (Trade No. 7), just 3 days later and with a loss. The market continued to drop and we were put back into the market on the long side (Trade No. 8) on Oct. 30. Here we caught a sharp rally but gave back much of the profit as prices declined almost as quickly as they rose.
Even so, we were able to take down profits of $l,590 as we reentered the market on the short side Dec. 23 (Trade No. 9). We then went long Feb. 16, 1982 (Trade No. 10), short March 29 (Trade No. 11), long April 12 (TradeNo. 12), and short April 30 (Trade No. 13) Ñ catching a good move down. We went long again July 8 (Trade No. 14) and held this trade through the duration of the test.
Now, with this exercise of following the system on the chart, you can probably already recognize some of the advantages and disadvantages of the system. One disadvantage is obvious; if the market is in a non-trending mode or a sideways chop as it is often called, your equity will continually be eroded. You may suffer a series of aggravating losses being constantly whipsawed until the market finds a direction. But you will never suffer a devastating loss.
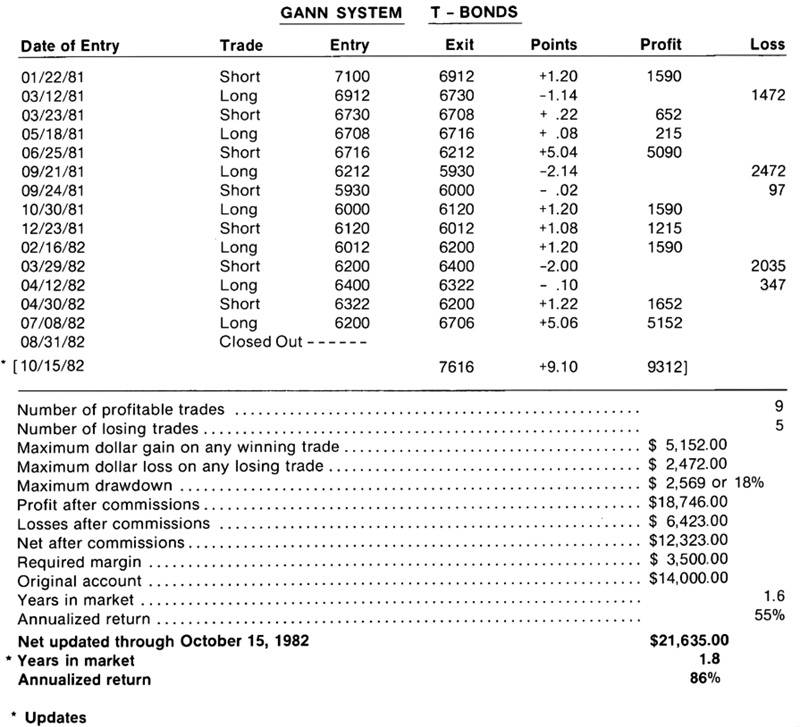
The main advantage to the system is you will never miss a major move. You may miss the first few days and you may overstay the move and give back some of the last part, but you will catch the major portion of it. Even more importantly, you will not be caught on the wrong side of a major move which can often be fatal. Now we will examine the results of this trading system. We had 9 profitable trades and 5 losing trades.
- The maximum dollar gain on any one trade was $5,152.00.
- The maximum dollar loss on any losing trade was $2,472.00.
- The maximum drawdown was $2,569 or 18%.
- The profit after commissions was $18,746.00.
- The losses after commissions totalled $6,423.00 for a net of $12,323.00.
The required margin for T-bonds at the time was $3,500. However, to trade 1 contract, we believe you should have $4 in your account for every $1 margined, or in this case, $14,000. This is mandatory so that you can withstand heavy drawdowns during choppy periods. The system was in the market 1.6 years and, based on a $14,000 account, showed an annualized return after commissions of 55%.
We officially ended the test on August 31st, however, since the market only recently began trending strongly, we decided to go back and update the results through October 15th. Our profits improved substantially and our annualized return was increased to 86%.
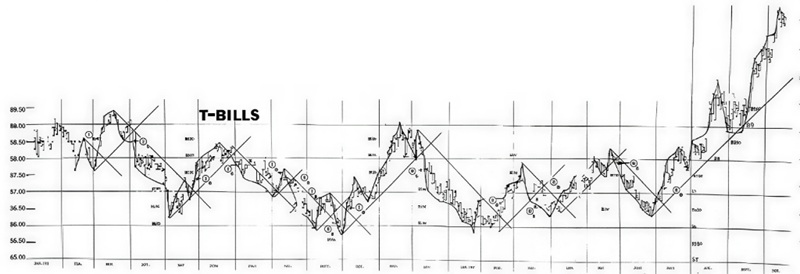
We also ran this system on the T-bills. We’ll now examine the results of this system.
- The number of profitable trades was 9.
- The number of losing trades was 10.
- The maximum dollar gain on any one profitable trade was $5090.
- The maximum dollar loss on a losing trade was $1660.
- The maximum drawdown was $2,695 or 27%.
- The profits after commissions totaled $19,505.00.
- The losses after commissions totaled $8,100.00.
- Resulting in a net after commissions of $11,405.00.
- The required margin was $2,500.
- Therefore we required an initial investment of $10,000.
- The system was in the market 1.5 years.
- Giving us an annualized return of 76%.
We also updated the T-bill results through October 15th and the annualized return was increased to 111%.