Trading Articles
Gann And The Time Factor By Koos Van der Merwe

Time is the most important factor when it comes to making trading decisions, so incorporate the time factor into your trading. W.D. Gann said he believed that time was the most important factor in forecasting market movement. He felt that time would overbalance space and volume but arrest momentum. “The future is a repetition of the past,” he opined, “and each market movement is working out time in relation” to a previous time cycle.
Gann wrote that in a rally cycle, when a price declines under an angle, price will often dip down to the next angle before finding support. In reality, this does not necessarily occur. Quite often, a price may come back to test an angle before continuing a trend. These support and resistance angle lines should never be confused with support and resistance trendlines because the angle lines can be used to indicate time.
GANN SQUARE With ANGLES
Looking back over history, you must establish the Gann square with angles. Once you have identified the Gann angles, the Gann fan can be projected from future highs and lows. Time is the most important factor in market trading analysis. If you are able to enter and exit a trade at the right time, you will be able to take all the profit available in the market. This can be demonstrated in Figures 1 through 6.
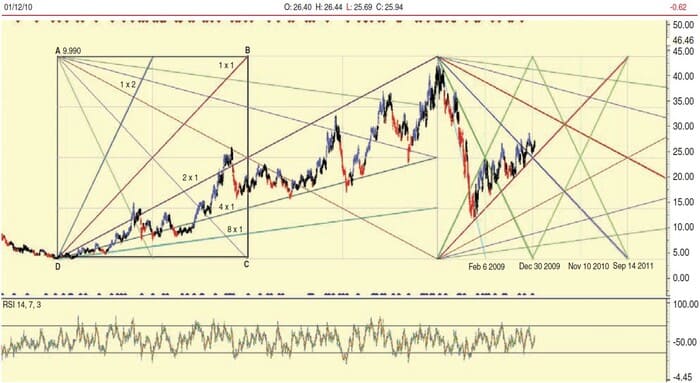
In Figure 1, I have established a Gann square. Note the Gann square ABCD on the chart. The 2×1 angle is the angle that has connected the low to the high, so it is this Gann fan that we now watch to determine time. Note what happens next. The price started off rising along the 8×1 angle, going up to test the 2×1 angle and falling back to the 4×1 angle. It then continued to rise with the 4×1 angle as a support and the 2×1 angle as a resistance.
Projecting the angles downward now that we have established them, we know the time. From the high, price fell sharply along the 8×1 angle to find support on the 1×1 upward angle. The low established should have occurred on February 6, 2009, but it did not. The angles also suggest time changes on December 30, 2009, November 10, 2010, and September 14, 2011. Can we trust these dates? The answer is no, so Gann the man must have used another strategy to develop time cycles.
Gann spent years in New York and London acquiring long-term price data for his research of the markets, with data going back to the early 1800s. He described so many yearly cycles that almost any future cycle high or low price would likely fall in any one of the many longer-term cycles from significant highs and lows. Discerning and determining which cycle is likely to be the cycle could not have been an easy task. Ignoring most of the cycles Gann analyzed, I have found the following to be the most effective:
- March 21–22 Spring equinox
- June 21–22 Summer solstice
- September 21–22 Autumn equinox
- December 21–22 Winter solstice
Major and minor trend changes are often found at or near these dates. These dates should be warning dates only, with normal trend analysis being the ultimate decision maker.
THE SQUARE OF 90
The 90-degree time unit is a square of 360 degrees. One degree of a circle is therefore 1/360. One day is 1/365.25 of a year, close enough for Gann to accept that one day in his terminology is equal to one degree. From this concept he further divided 90 into 8ths, in counts of 11, 22, 34, 45, 56, 67, 79, and 90, reasoning that trend reversals from an important cycle high or low could occur on these days from day 1.
THE SQUARE OF 52
Gann also analyzed the square of 52, which he applied to weeks, not days, so he would look at 6.5, 13, 19.5, 26, 32.5, 39, 45.5, and 52 weeks, with those in bold the most important. In both squares of 90 and 52 he believed that counts should always be continued until the extreme high or low whence the count began is exceeded.
THE SQUARE OF 144
Gann used the square of 144 on monthly charts because there are 12 months in a year. These time divisions and multiples often result in a change in the market at the exact period indicated, but to be on the safe side, look for changes to occur two to three periods before or after the period indicated.
SQUARING OF PRICE WITH TIME
Gann commented that if the trader watched a stock when time and price came together, the trader would be able to forecast changes in trend with greater accuracy. He added that the square of the extreme high on the monthly chart was very important, and when applied to a daily chart, it was crucial in indicating a potential trend change.
Suggested Books and Courses About Gann Techniques
Time is the most important factor in market analysis and decision making, but time must be considered together with pattern and price rules for an indication of a trend change. You must never trade solely from timing signals. The most profitable setups with the least risk occur when there is a confluence of time, price, and pattern.
RULES IN TIMING
- 1Always determine the position of the market relative to its yearly cycle. Change may occur months or weeks before the anniversary date, depending on the cycle length.
- Note all anniversary dates. Minor and major trend reversals are inclined to occur at or near a previous major high or low.
- Watch seasonal time periods — that is, the equinoxes and solstices. Changes often occur at or near these dates.
- Determine important prices squared in time.
- A change in trend often occurs at daily, weekly, and monthly counts of the divisions of the square of 144, 90, and 52 from important highs and lows.
- Watch the days 11, 22, 33, 45, 56, 67, 78, and 90 from a low or high. The period “101 and 112” is referred to as the death zone because most corrections occurred at this count, according to Gann — I have not personally found this, but I remain mindful of it.
DU TOIT ANALYSIS
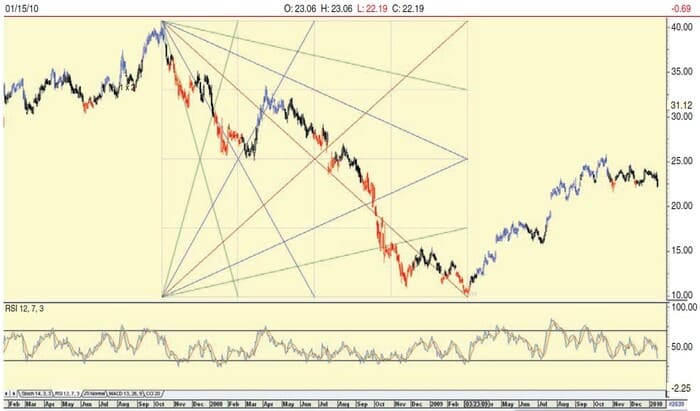
After studying W.D. Gann’s system over the years, analyst Franco du Toit developed a strategy for identifying time, combining the square of 90 and the equinox and solstice periods, that has proved very effective over the years. Du Toit determined the long-term Gann square with a Gann fan as shown in Figure 2. I have used the price chart of eBay as an example.
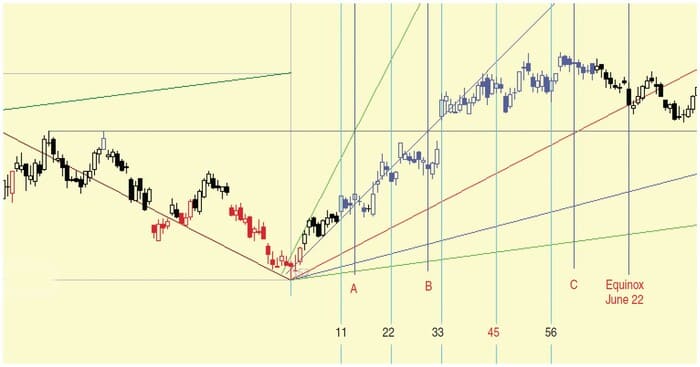
Knowing the parameters of the Gann fan, du Toit would project it forward from the new low as shown in Figure 3. He would mark off the number of days from the low and also the equinoxes and solstices. He would then mark the time periods where the Gann angles would cross the horizontal line from a previous strong pivot point. The 1×4 angle suggested the time period as shown by A, the 1×2 angle (B), and the 1×1 angle (C). Note how close the time periods are to the turning points on the chart.
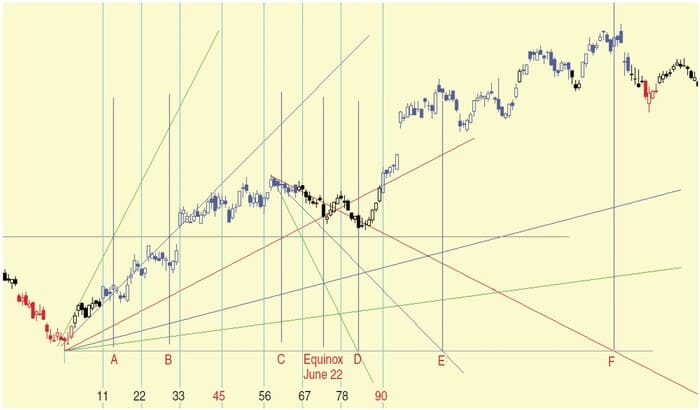
Du Toit then projected the angles forward from the next pivot point as shown in Figure 4 and once again identified the time periods where the angles cross the horizontal from the previous pivot point. Note how angles 4×1 (D), 2×1 (E), and 1×1 (F) have identified major highs and lows. These time periods are noted for the future.
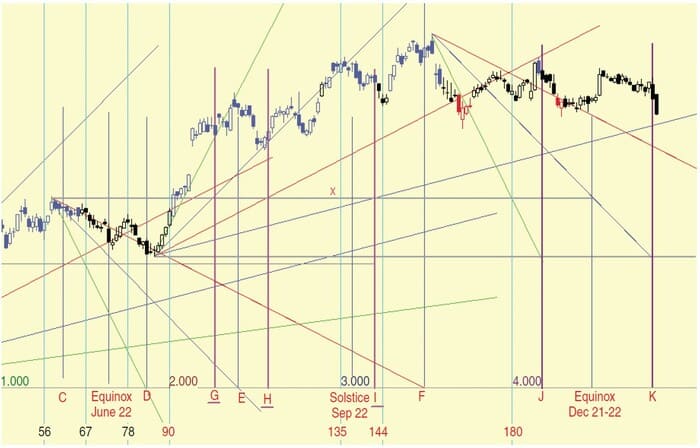
In Figure 5, I have once again projected the angles from a pivot point low and high. I have also plotted the solstice and equinox dates as well as the 135 and 180 date levels. If you choose, you can chart the intermediate dates. The chart does look complicated, but Gann charts always do. The recent 4×1 angle picked up a high at J and the 2×1 angle is suggesting that K is a low and eBay should now start moving upward. In addition, note how the December equinox found a minor pivot point.
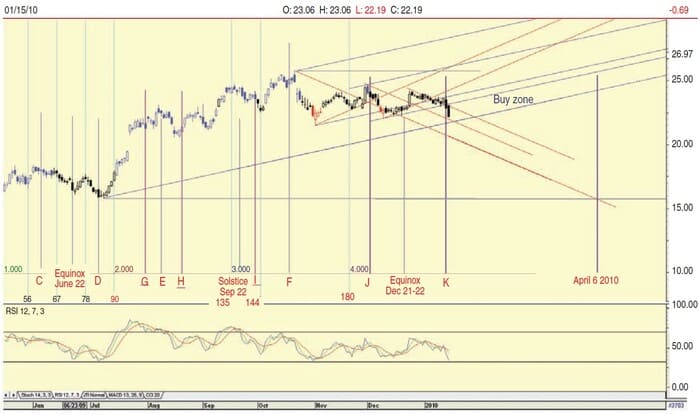
Combining the price chart with a time chart for eBay, we get the chart displayed in Figure 6. The price of eBay as of January 14, 2010, is in a buy zone. However, it can also be considered to be in the sell zone, and any move below the 2×1 rising angle line (blue) will confirm this. The Gann time chart, however, suggests that a turning point should occur at the current price.
Suggested Books and Courses About Market Timing
Note that the relative strength index (RSI) has not yet given a buy signal, but it is close. W.D. Gann would wait for a definite trend direction to be established. Should the price reverse itself, he has an upside target zone as well as the time the price should reach a top — April 2010. If price continues to fall, April 2010 would be a major bottom.
Gann always believed that action should be taken only when the market showed an indication of a change or continuation of a trend. You should never take action on expectations alone.
TRADE ON WHAT YOU KNOW
Gann did not explain the causes of market activities, but he did describe specific techniques, indications, and rules that describe market activity. He was a stalwart believer in natural laws, going so far as to consider full moons and other planetary movements in his analysis that gave his work an aura of mysticism.
There are many other Gann methods and rules out there that I have not described in these series of articles, simply because they have not proved themselves to be reliable or profitable. Study Gann techniques, practice them, and satisfy yourself that they do indeed work. And above all, make money by following the trend.
Koos van der Merwe is has been a technician since 1969 and has worked as a futures trader and finally as a technical analyst with a stock brokerage firm in Johannesburg, South Africa. Currently, he acts as a consultant for a fee of $1, a charge he believes is necessary because free advice usually does not carry much weight. He may be contacted at petroosp@ gmail.com.