Trading Articles
Fixed Fractional Forex Variants By Gonçalo Moreira

How many lots are you going to buy or sell? Here are some variations of the fixed fractional model, as applied to an intraday strategy that trades the British pound/US dollar. Before entering the market you must decide how many lots you plan to buy or sell. What goes into your process of determining the amount? This article will help you answer that question consciously instead of just pulling a number out of a hat. Too many traders invest inconsistent amounts in each trade, even though all they have to do is follow some simple techniques, variations of the fixed fractional model developed by analyst Ralph Vince.
IMPORTANCE OF POSITION SIZING
Money management is like a thermostat: It’s a control system for risk that keeps trading within the comfort zone. Position sizing is a key element in money management: It is about scaling your position size in such a way that you are always aiming to maximize a runup in equity and reduce the effects of a drawdown. If you take too small a size on each trade, the returns will be too low to overcome transaction costs. Conversely, by risking more, the returns will increase but so will the potential drawdown.
To illustrate the different variants of the fixed fractional model, I will be using the backtesting results from an intraday strategy on the British pound/US dollar (GBP/USD) between 2005 and 2009. Some of the techniques outlined here address growth potential while others address risk. Whichever technique you decide to adopt will depend on your trading style.
THE FIXED-LOT MODEL
I will first review the performance of the strategy where the position size is constant (fixed lot or fixed value). It is the simplest of all the available techniques. With the fixed-lot model, you set the number of lots you would like to trade per position. Regardless of how much your account equity curve oscillates, you will still trade a fixed number of lots per position.
Say you have a $10,000 account and you trade one mini lot per trade. This means that a fixed-lot size of one mini lot averaging 10 pips per trade would grow by $1,000 after 100 trades. After the first 100 trades, your return would be 100%, but after 1,000 trades, the same result in pips would end up with a return of 10%. It is calculated thus:
US$1,000 + 1,000 pips @ 1US$/pip = US$2,000
US$2,000 + 1,000 pips @ 1US$/pip = $3,000
US$3,000 + 1,000 pips @ 1US$/pip = $4,000
…
US$10,000 + 1,000 pips @ 1US$/pip = US$11,000
The fixed-lot model has its advantages and disadvantages, in that:
Advantages:
- It is a simple strategy because its lot size is consistent.
- Profits grow arithmetically — that is, by a constant amount per time period. If you withdraw your profits after each month and then start trading anew with the same capital, then this strategy is very useful. Some traders prefer to do it this way because they tend to perform poorly if their accounts grow exponentially. Other traders prefer to trade with a large account and withdraw their profits regularly.
Disadvantages:
- You cannot maintain a constant leverage because your account balance shrinks and rises. If you have a string of losses and your leverage still increases with each new trade, it can result in large drawdowns.
- You will soon discover that trading results are dependent on whether the system continues to work when you trade the same position size on any given trade. But the purpose of adopting a position sizing technique is to get rid of the burden of the system’s profitability.
- Every time you withdraw from the account, it will put the system a fixed number of profitable trades back in time. Therefore, this may not be the best model to trade if you are looking for your trading account to grow efficiently.
These are the basic statistics from the strategy during the five-year backtesting period:
- Total trades: 291
- Win trades: 134
- Win rate: 46%
- Losing trades: 102
- Loss rate: 35%
- Breakeven trades: 55
- Breakeven rate: 19%
- Return rate: 295%
- Maximum drawdown: $497; 24.9%
- Avg. win: $82.6; 1.9%
- Avg. loss: ($50.7); (1.1%)
- Avg. profitability: $55; 1.3%
- Std. dev.: 1.6%
The resulting equity curve (Figure 1) is an ascending line.
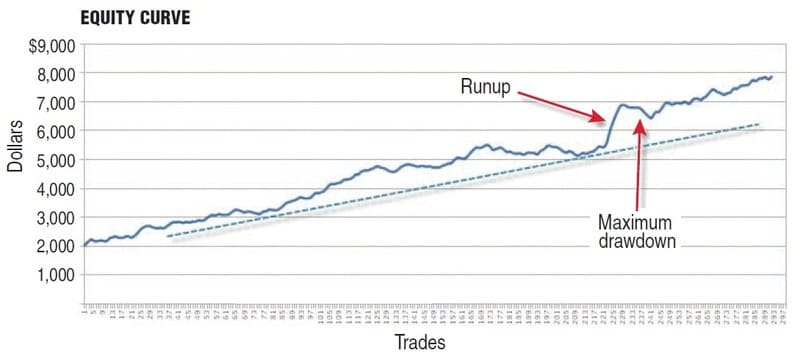
FIGURE 1: FIXED-LOT MODEL. With a constant position size, your profits grow arithmetically. You can see this in this ascending line.
FIXED FRACTIONAL MODEL
The fixed fractional position sizing was developed by Ralph Vince in his book Portfolio Management Formulas to remedy the problem of equity drifting out of proportion with respect to the fixed-lot size discussed in the prior model. Since then, it has been popularized by Alexander Elder as the “2% rule.” This technique, which directly incorporates trade risk, is the most adopted among retail forex traders. By always risking the same fraction, the amount at risk stays proportional to equity.
The risk of a trade is defined as the amount of capital you would lose per trade. Think of the amount of risk you take per trade as the size of the maximum loss of each trade (by means of a stop-loss order, for example). If your system doesn’t use protective stops, the trade risk can be taken as the maximum drawdown or average loss. Here is the formula for calculating position size taking equity into account (keeping in mind there can be different definitions of equity):
Position size = ((Equity x Risked equity per trade) /Pips risked)/Pip value per standard lot
The advantages of the fixed fractional model are:
- Since the size of the trade stays proportional to the equity, it is theoretically impossible to go entirely broke. The official risk of total ruin is zero. As an anti-martingale technique, it is designed to preserve your capital for as long as possible. In reality, however, you should abandon a trading methodology long before your account gets depleted.
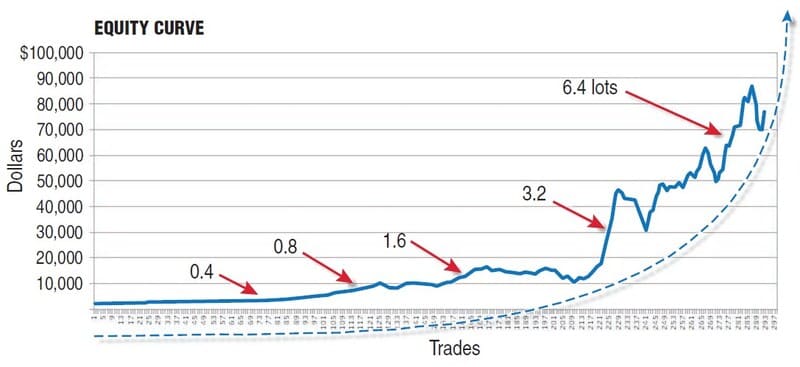
- The compounding effect kicks in every time you have a winner. By using this method, the size of your position gradually increases when winning and decreases when losing. Increasing the size of positions during a winning streak results in geometric growth of the account (also known as profit compounding). Decreasing the size of your position size during a losing streak minimizes the damage to your equity. This can be seen in the exponential ascending equity curve in Figure 2.
- At lower percentages of equity being risked, a winning or losing streak simply does not have a spectacular impact on the equity curve. This results in smoother capital appreciation (and much less stress for the trader). This is because when you risk small fractions of your equity (up to 3%), each trade is given less power to affect the shape of your equity curve. This leads to smaller drawdowns and consequently to a greater ability to capitalize on the winning signals in the future — that is, the size of drawdowns is directly proportional to the percent risked.
The disadvantages of this model are:
- This model requires different returns at different position size levels. This means that every time you want to increase your position size, it may be necessary for you to produce a high return before you can increase the size of your trade from one lot to two; otherwise, you would be risking too much. So for smaller account sizes, it will take a long time for this model to actually kick in.
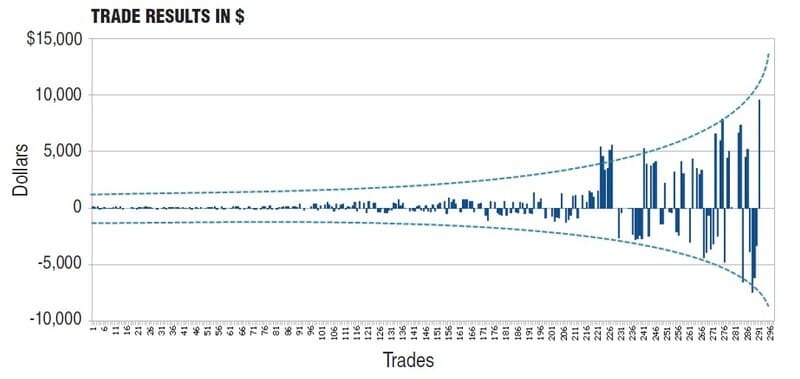
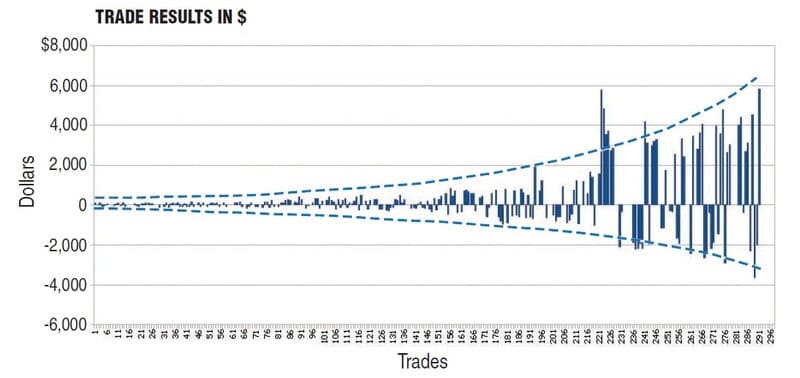
- For larger account sizes, the number of traded lots will jump around, as seen in the second half of the trade distribution in Figure 3.
- Reducing your position size after every loss makes it more difficult to recover from a severe drawdown and makes this model an anti-martingale type of technique. It should be used only if you have enough statistical data on the drawdown series.
- If you have a small account balance, you are forced to work with a lot size. This doesn’t help in sizing your positions. This happens when the smallest lot size provided by your broker is bigger than your smallest trade size or when you are unable to round your lots to the ideal size. For example, if a large loss occurs and the risked fraction is now less than the smaller lot size, you are forced to break the risk rules just to trade the minimum allowed lot size.
- Once your account becomes larger, the growth of your position sizes accelerates to an unrealistic and risky degree. This is seen in Figure 2.
The equity curve in Figure 2 shows the strategy with the same starting capital of $2,000 initially trading one mini lot, which is a sensible thing to do with an account of this size. By the time the account size doubles, the trade size also doubles. This means that the same amount of pips is always needed to double your account size. The downside of this technique is that each time you increase the trade size, you are also increasing the dollar amount risked and any violent drawdown can severely damage your account.
Risking a high percentage of your account might indeed have a dramatic effect on the geometric growth of your account balance in the short term. This happens because winning streaks (however long) may be followed by losing streaks (however short) and much of what was given by the high percentages is very likely to be taken away by the same percentages.
But even if you keep your risk percentage the same — as in this model — as your available capital grows, the amount of capital risked increases. This is clearly seen in the graph showing the dollar value by trade in Figure 3.
Suggested Books and Courses About Money Management
VARIANT 1: PERIODICAL FIXED FRACTIONAL
In this variation, I recalculated the percentage risked only if after a certain time period the account equity changed. The advantages are:
- This will smooth the compounding mechanism during winning and losing trades. If you win 10 trades in a row using the fixed fractional method, you will compound significantly because after each trade you are taking the new balance into account to reevaluate your absolute risk amount. When using the periodical fixed fractional model you do not change your trade size, even if you are having a winning or losing streak. This breaks the geometric growth of the equity curve and all its associated perils.
- Your results will be similar to the fixed fractional model if the frequency of your trades is close to one trade per day by compounding every day. The more it varies, the greater will be the difference.
- You can’t expect huge compounding returns by compounding every month, but you are also locking in your risk. Your maximum profit potential will not be dependent on the sequence of your profitable and losing trades. By compounding per month, your result will always be the same. The performance of your system will be less affected by winning and losing streaks.
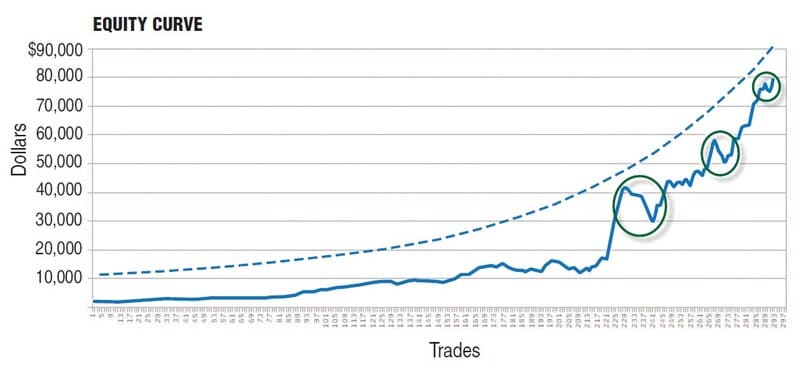
In my backtesting, I change the position size every six months. This stacking effect results in a staircase-like equity curve (Figure 4), which is less accelerated than in the original fixed fraction by Ralph Vince. In addition, note how the runups and drawdowns in the green circles are less pronounced than in the previous model.
The disadvantage is:
- The problem with this technique arises when you have a string of losing trades. This causes your account to decrease, which means you have a smaller position size. Hence, you must get your account size back up.
Figure 5 shows the distribution of trades for the periodical fixed fractional model. Note that it is less accelerated in terms of your gains/losses per trade.
VARIANT 2: SPLIT FIXED FRACTIONAL
The profit risk position sizing method is another variation of the fixed fractional position sizing. Here, the dollar amount risked on a trade attributes a different risk level to the fraction of the starting account balance and the fraction of the accumulated profits. The number of units risked for both parts is calculated in the same way as in the fixed fractional method — that is, the amount to be risked is divided by the trade risk per unit. This variant may be convenient for more aggressive trading styles because it separates the account balance into starting capital and the accumulated profits. The risked fraction applied to the starting capital provides a base level for position sizing independent of trading profits. Needless to say, if both percentages are the same, the split fixed fractional method will produce the same result as the fixed fractional model. The advantage is:
- This strategy is for traders looking for a higher risk/return relationship while preserving their starting account balance. It gives more potential for higher returns while still risking the same low fraction of the initial deposit.
The disadvantage is:
- With the increased risks in the profit fraction of your account, if a drawdown occurs when trading with the first accumulated profits, it may force the trader to start anew if the profit buffer is depleted by a string of losses.
VARIANT 3: MEASURED FIXED FRACTIONAL
All traders have been through the experience of giving profits back to the market after a winning period. This usually happens when the adopted position sizing model is not adequate to the kind of trading methodology used or when there is no position sizing at all. The measured fixed fractional is another variation of the fixed fractional model that aims to protect the trader’s gains. Like other position sizing models, this one increases and decreases the trade size on a regular basis, but it scales the growth of your account balance in portions. Instead of increasing the position size after each trade or after a certain time, it does so after a predefined amount of capital growth. The advantages to this variation are:
- It smoothes the equity curve more than that of the traditional fixed fractional model.
- It simplifies calculations since the position size only has to be changed once the account has grown a certain amount.
- It helps traders recover faster from losses because the position size is not reduced immediately after any loss. You are still trading with the same size, and although your leverage might increase, it does so only slightly.
The disadvantages are:
- Although leverage doesn’t swing as wildly as in the fixed-lot model, it is not constant, either.
- For more aggressive traders, it may represent an impediment to profit from the compounding effect during a winning streak.
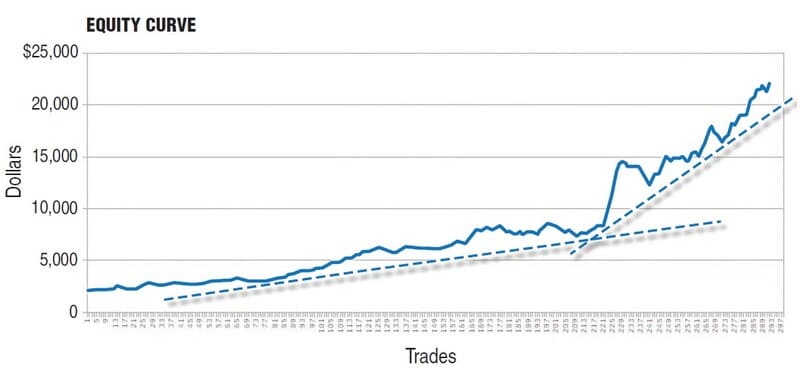
Figure 6 shows the equity curve of the measured fixed fractional model when there is a doubling of the position size in increments of 50% of equity. The measured fraction is calculated simply by rounding down the available capital to a lower fraction. Depending on your trading style, you can, for example, increase the measured fraction each 1,000 units of accumulated profit, set any other benchmark, or in a percent increment of your equity. This method further smoothes the exponential character of the fixed fraction–driven equity curve. Observe how the following statistical figures differ from those of the fixed lot model:
- Total trades: 291
- Winning trades: 134
- Win rate: 46%
- Losing trades: 102
- Loss rate: 35%
- Breakeven trades: 55
- Breakeven rate: 19%
- Return rate: 1009%
- Max. drawdown: $1,610; 12%
- Avg. win: $280.3; 3.4%
- Avg. loss: ($170.4); (2%)
- Avg. profitability: $188.8; 2.3%
- Std. dev.: 2.8%
WHICH METHOD WORKS FOR YOU?
Traders who risk too much increase their chances of not surviving long enough to realize the long-run benefits of a good trading strategy. Conversely, risking too little creates the possibility that a trading methodology may not realize its full potential. While positive statistical results may be a minimal requirement for successful trading, the way you exploit that statistical edge will largely determine your success as a trader. This is where position sizing plays a determinant role. With all that in mind, you may consider adopting one of the three variants of the fixed fractional model discussed here for your own trading.
Gonçalo Moreira is a trader in the foreign exchange market. He is responsible for content quality and education at FXstreet.com.