Trading Articles
Entering Trades At Pullbacks By Candy Schaap

When opportunities knock, tell them to come in! Here’s how pullbacks in trends offer opportunity. A nybody who has ever bought an asset, whether it’s bonds, stocks, mutual funds, or real estate, knows that prices go up and down. Prices fluctuate between support and resistance most of the time. This is information that technical analysts use for trend trading and countertrend trades. A countertrend trade is also known as a scalp trade. As price moves back to support in an uptrend, or up to resistance in a downtrend, there is an opportunity to make money in the trend. Let’s look at trend dynamics to understand how to make entries into a trend by entering at pullbacks.
FOLLOWING THE MOVE
One aspect of technical analysis is the study of price activity and trend. Traders cannot control price, but how they react to its movements is the difference between profit, a small loss, and a large loss. Using a trendline can help you identify a trend, a pullback in a trend, and when a pullback becomes a reversal. A trendline will also give you an objective way to manage risk. Figure 1 shows a price chart, pivots, and a trendline. The arrows point to pivot lows. It takes a minimum of two pivot points to draw a trendline. The solid line is the start of the trendline connecting a pivot low and a higher pivot low. The extension of the line (dotted) shows the trendline as visual support.
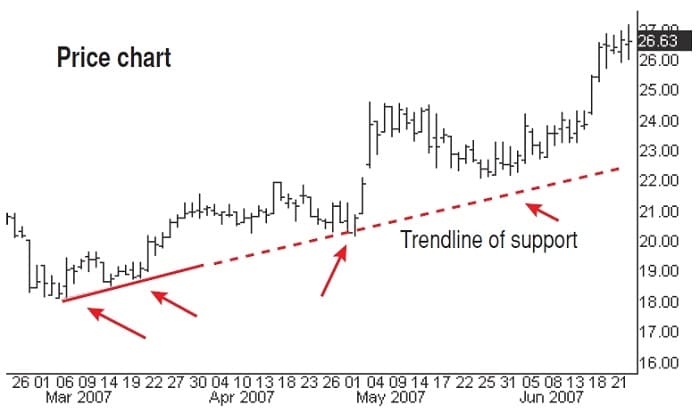
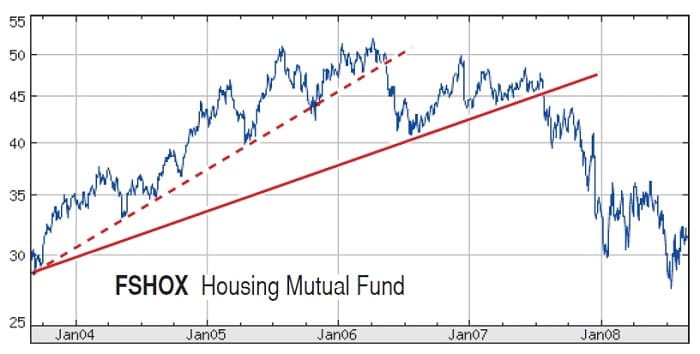
We cannot know what price will do. We must know what we will do in reaction to price. Once we have drawn the trendline, a long trade is valid above the uptrend line and stopped out if price moves below the trendline. The uptrend in Figure 1 shows the prevailing direction of price. A trader may take profit at a reversal with the preparation for a pullback to support, also known as a scalp trade. The dynamics of a trend can also be used to manage a mutual fund position (Figure 2). This method shows when to stay, when to add, and when to go away. You can use a trendline to see when price has a pullback and a continuation, and when the pullback becomes a reversal. When you learn a few rules of trend dynamics, you can manage a trade, manage your portfolio, and even manage your individual retirement account (IRA).
SHORT MOVES ON A BREAK
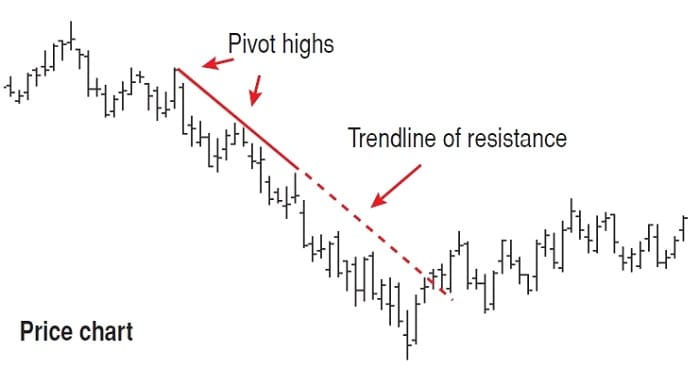
The break of the trendline is an exit or a possible short trade. Look for the same price action in reverse. The trendline is now the area of price resistance (Figure 3).
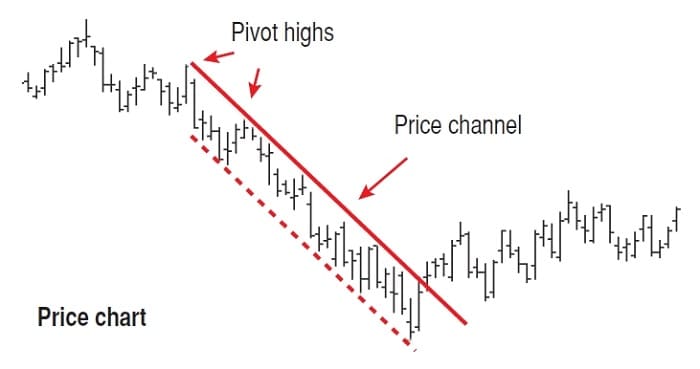
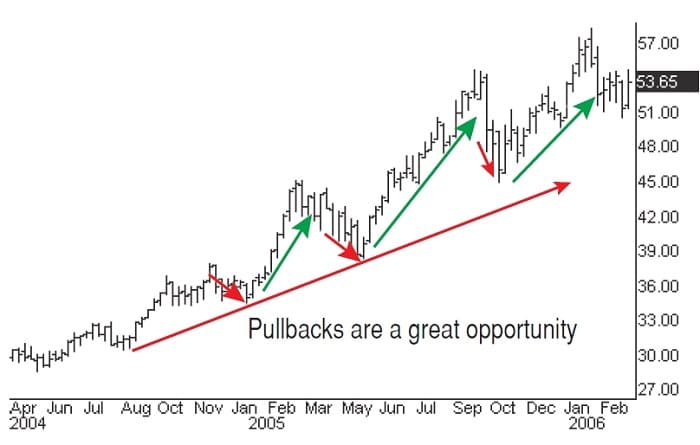
Another useful charting tool is the addition of a price channel (Figure 4). A price channel is the price action contained between two parallel lines, framing the fluctuations of price from support to resistance and back. You know when to get into a trade when price is trending. Every pullback offers an opportunity for a swing trade in the direction of the trend.
In Figure 5, the red arrows show the pullbacks and the green arrow shows the continuation in the trend. This is the edge to letting your profits run. Knowing about trendlines will help you identify support and resistance levels. You can determine trend direction and pullbacks for a swing or scalp countertrade.
BEWARE THE HEAD FAKE
But you need to do more than just identify trends or support and resistance levels. Technical analysts check the evidence for confirmation. They study price action for direction of price, support, and resistance. The information is used to manage risk and have an adequate possibility of gain. This is what trendlines do. Once you have an uptrend line, go long with a stop-loss below the support. Once you have a downtrend line, go short with a stop-loss above the resistance. A pullback or retracement can be the perfect place for entering into a trend and/or adding to profitable positions. A pullback can also lead to a reversal, so beware of a “head fake,” where price appears to be going in one direction but veers to a different one.
Pullbacks are a fine way to enter a trade as long as there is an exit when the dynamics of a trend change.
Suggested Books and Courses About Price Action
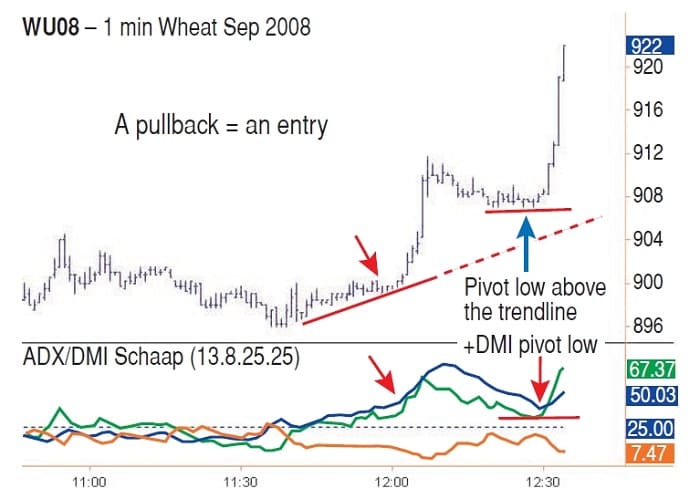
Let’s see how trendlines give entry in a pullback, and then we can check the evidence as follows: We have an uptrend line and the completed pivot low above the uptrend line (Figure 6). We have added the ADX/DMI to add evidence to what we see.
But how can we avoid a feint? Figure 7 shows the trendline and a pullback that continues and then at the last arrow, it is a pullback that fails. On entry, a trader manages risk with a stop-loss under support; in this case, that is the trendline. The red arrow shows how losses are minimized with the stop-loss when price changes direction.
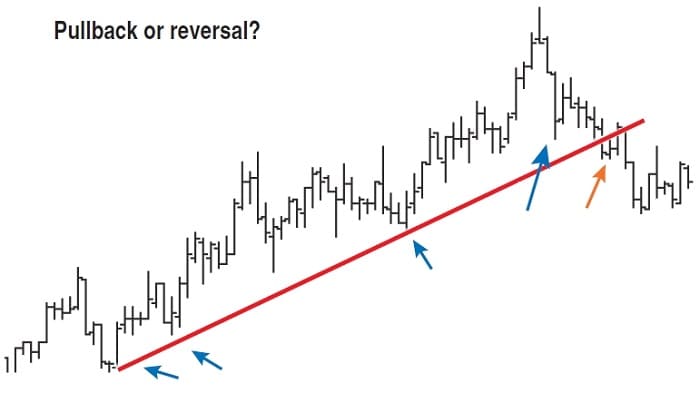
Here’s the deal with the feint. The last pivot low, marked with the larger black arrow, was not a completed pivot low. Using a stop-loss below the trendline will limit loss, but understanding pivot price signals is a clue to better trade positions. Better positions will more often lead to better profits. Let’s look at Figure 8 with ADX as the confirming indicator. See what the evidence tells us about the trend.
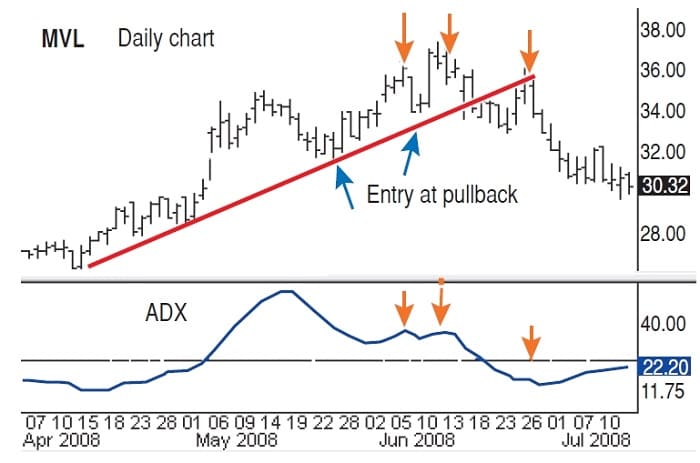
In this case, there is entry at pullbacks above the trendline. A stop-loss under the trendline limits your loss. But now check the technical evidence: The third price peak is a lower pivot high and all three peaks coincide with a lower ADX. The three pivot reversal forms a head & shoulder pattern. So there were two clues to suggest you take profits or stay out of the trade.
The use of a trendline is a simple way to see trend direction and price pullbacks for entry opportunities. The ADX/DMI is one indicator that can add to the information on a chart. Proper understanding of price sets up the trade; proper understanding of the indicator sets the strategy. It is not necessary to predict direction merely to manage the trade. Pullbacks are a fine way to enter a trade as long as there is an exit when the dynamics of trend change.
Candy Schaap and her husband, Charles B. Schaap, are a trading team. He is the author of the book ADXcellence: Power Trend Strategies. Candy Schaap started her career hedging futures for a large corporation and has 25 years of trading experience in futures, options, stocks, and bonds. She consults and lectures and writes financial articles. She also publishes the ADXcellence Trade Letter and mentors the TraderDoc Loot Camp.