Trading Articles
Empowering Traders With The Russell 2000 By Gail Mercer
Ever thought of trading the Russell 2000? Here’s how retail traders could benefit from trading this index. New traders are drawn to the emini Standard & Poor’s 500 like bees to honey. Go into any live trading room and chances are that the moderators are teaching traders to trade the emini S&P 500 because it has more liquidity than any other market. In Figure 1 the average annual volume is compared between the following emini indexes: emini S&P 500, Dow Jones Industrial Average (DJIA), NASDAQ 100, S&P MidCap 400, and the Russell 2000. It would be a logical assumption that the emini S&P 500 moves more than any other market. After all, volume fuels the markets, and the emini S&P 500 has more volume than any of the other indexes. However, let us look closer to see if the emini S&P 500 leads in tick movement or dollar movement.
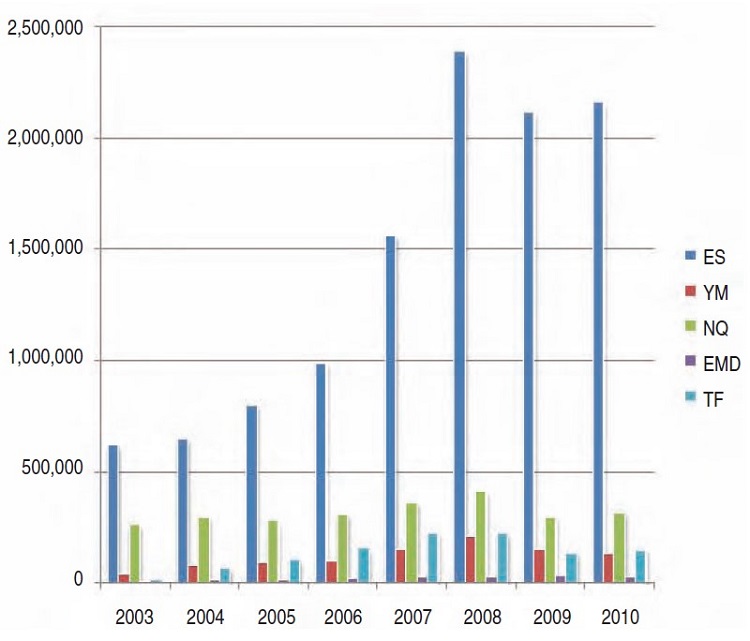
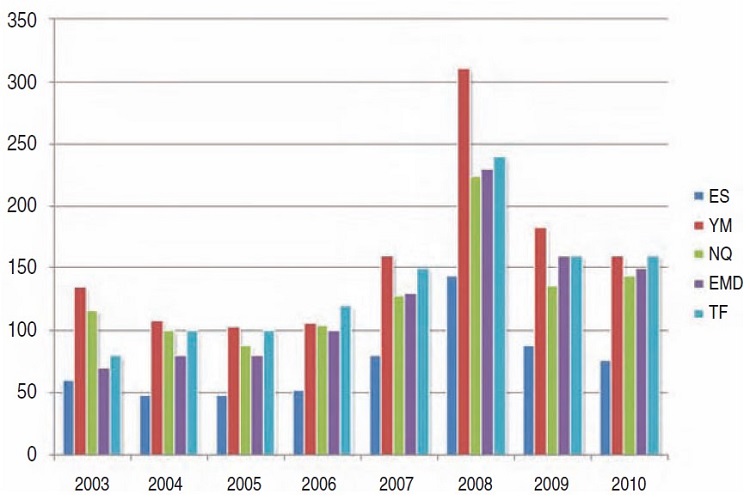
Figure 2 compares the average annual tick movement between the following emini indexes: S&P 500, DJIA, NASDAQ 100, S&P MidCap 400, and the Russell 2000. As you can see, the emini S&P 500 is no longer the leader. In fact, during the eight-year analysis period, although the emini S&P 500 had the highest volume, it was the lowest in tick movement when compared to the other markets.
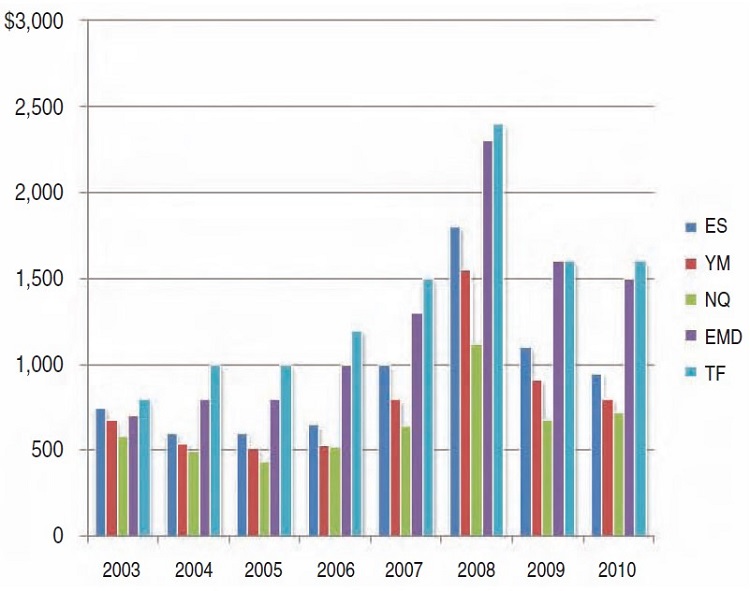
If volume fuels the markets and the emini S&P 500 has the most volume, why is it consistently lower in tick movement than any of the other markets? Since each market has different tick values, perhaps we need to compare the average dollar movement to find the answers. In Figure 3 you see a comparison of the annual average movement in dollar amounts of the emini S&P 500 with the following emini indexes: DJIA, NASDAQ 100, S&P MidCap 400, and Russell 2000. While the emini S&P 500 is not the lowest in dollars compared to the other markets, it is definitely not the leader. In fact, when comparing just the indexes, the emini Dow is the leader in ticks, but the Russell 2000 is consistently the leader when comparing dollar amounts. This is due to the difference in tick values. The emini Dow is $5 per tick and the emini Russell 2000 is $10 per tick.
VOLUME OR PRICE MOVEMENT
So why are new traders drawn to the emini S&P 500? Because new traders have very little market experience and do little or no research to see which markets move more dollar for dollar, and they do not understand that traders may have different objectives. For example, high-volume traders focus more on liquidity than on capturing a large swing in price because, as the name implies, they are trading a large number of contracts. They have identified a high-probability setup that yields small profits on a consistent basis. So the one point of profit that is captured from a high-probability setup, when traded in large volume, can become $5,000. How? By only trading in markets that have sufficient liquidity, like the emini S&P 500.
Going back to Figure 1, you can see that the emini S&P 500 can easily handle orders for 50 to 100 contracts at a time. Using a one-point profit target and stop-loss of one point (one point in the emini S&P 500 equals $50 per contract), and trading 100 contracts, you have a potential gain of $5,000 if the one-point profit target is achieved. If you lose one point, then you have a loss of $5,000. High-volume traders must have experience and a sufficient account size so that one or two losses will not wipe them out.
Today, most traders have come into trading after being laid off between 2007 and 2009 from other professions. These new traders often lack trading discipline and trading experience, and are quite often undercapitalized. While there is an overabundance of information available, sorting through all of the data can be overwhelming for new traders, especially since they are faced with the daunting task of replacing their income. They opt to simply join a live trading room and play follow the leader.
Suggested Books and Courses About Market Indicators

However, new traders are at a disadvantage in these rooms because they know little about the different markets available and typically have smaller accounts than the moderator, and their ability to react on the live edge of the market is also slower. So what can these new traders do to overcome the numerous obstacles in their path? They need to take control of their trading.
THE 10% RULE
The emini index markets open at 9:30 am Eastern time and market reports come out between 8:00 and 10:30 am Eastern time. During these market reports, price is often reactionary, meaning that traders and price are reacting to news and economic reports. Since traders are reacting to announcements and price can often move quickly, it is not the best time for new traders to be in the market.
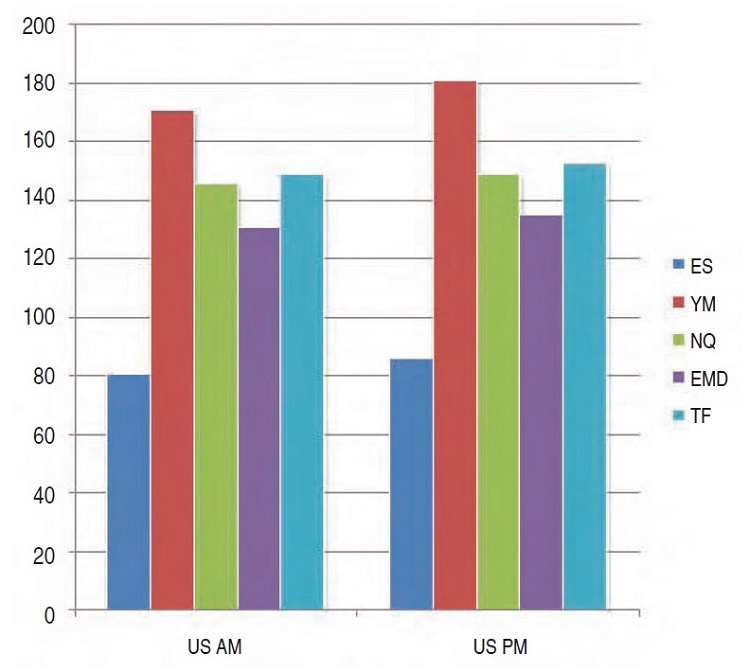
In Figure 4, note the average movement in ticks for the US morning and afternoon sessions. As you can see, the indexes actually move more in the afternoon session than the morning one. However, there are fewer market reports in the afternoons and, therefore, fewer reactionary movements. And how does this movement compare in dollar amounts? Figure 5 shows that the Russell 2000 is the biggest mover, dollar for dollar, in the afternoon session, followed by the emini S&P MidCap 400.
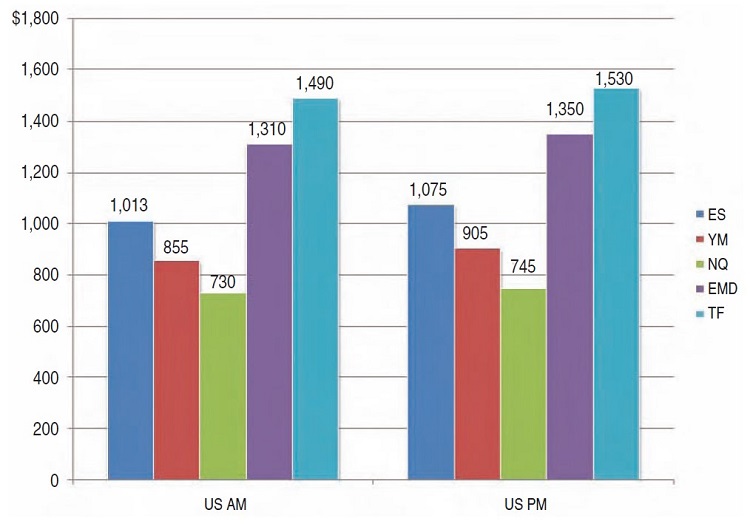
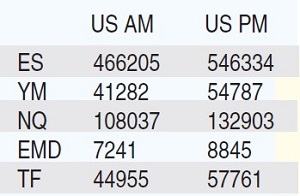
The next step is to ensure there is sufficient volume for the afternoon session. Figure 6 indicates that the volume actually increases in the afternoon. Based on this knowledge, you can set reasonable profit targets and stop-losses. A simple yet effective method I teach new traders is the 10% rule. The 10% rule means that the new trader sets his or her first profit target to 10% of the average tick movement. For example, Figure 7 displays the average tick movement per index for the morning and afternoon sessions.
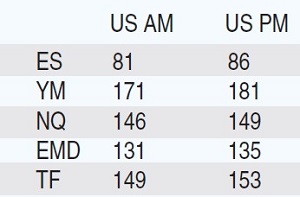
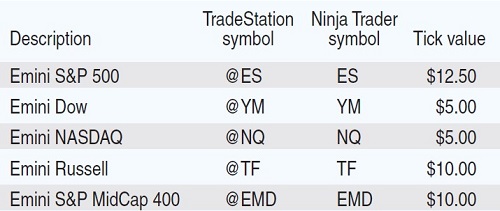
Using the 10% rule, a trader looking at the emini Russell 2000 would set a profit target of 16 ticks. By using a risk-to-reward ratio of 1:2, meaning for every dollar of risk there is $2 of potential reward, the stop would be eight ticks. The trader has now set a reasonable profit target and, using a risk-to-reward of 1 to 2, has identified the stop-loss as well. And how much is 16 ticks on the emini Russell 2000? It’s $160. Since new traders should bolster themselves with knowledge, the tick value for each of the indexes is shown in Figure 8.
EMPOWERING TRADERS
Finally, the new trader is strengthened with the knowledge that:
- Market reports occur during the US morning sessions
- Market reports create fast price movements
- Indexes move more during the US afternoon sessions
- Volume increases during the US afternoon sessions
- The index with the highest dollar movement is the emini Russell 2000, followed by the emini S&P MidCap 400, and
- The 10% rule has 1:2 profit targets and stop-losses.
Gail Mercer is a trader, director, and instructor for traders-helpdesk.com, and is known as an “indicator expert.” Mercer hosts a free live trading room where she teaches forex and index traders how to approach the markets. She currently trades futures, forex, indexes, and stocks.