Trading Articles
Elliott Wave Theory Simplified By Koos Van Der Merwe

Elliott wave counts can get complicated, but it doesn’t have to. Here’s a simplified look at how to study Elliott wave theory. In the late 1920s, Ralph Nelson Elliott came to the conclusion that the movement of the stock market could be predicted by identifying a repetitive pattern of waves. He theorized that movement in the market was the result of investors’ reaction to outside influences.
Over my years as a trader and investor in the stock market, I came to realize that the outside influences that Ralph Elliott believed moved the market was nothing other than emotion. In my 50 years as a pharmacist, I found that emotion played a tremendous part in the physical and mental health of a patient. I also found that health and emotion occurred in cycles more obvious in women than in men. Eventually, I determined that the gravitational attraction by the moon plays a real part in how a trader trades. After all, the gravitational pull creates the tides in the ocean. More than 80% of the human body consists of water. So even by a small degree, that same lunar gravitation must influence the movement of water, chemicals, and proteins within the human body, and in this way influence the emotions of a person, especially of a trader who lives high on the knife edge of emotion.
Ralph Elliott came to the conclusion that the market moves upward in five waves, and corrects in three waves. I first encountered the Elliott wave theory in 1969 and have been an avid follower and student since then. I have studied wave patterns but over the years have found that the complexity of the wave theory leads only to complexity in interpretation. Thus, I decided that simplicity was the answer, and so, the simpler the wave, the easier the interpretation. To achieve this simplification, I decided on the following set of rules.
THE RULES EXPLAINED
1.The Elliott wave is a signpost in the wilderness, and must be regarded only as that.
The Elliott wave tells you where the market is going. Is the market in a three-wave bull market moving upward, or is it in a corrective phase downward? Are you trading in a bull market, or are you taking bets in a bear market? In a bull market, you know that for the long term the trend should be up, and whatever you buy, if the fundamentals of the stock are sound, you will score. In a bear market, you sell your holdings on the upward correction if you are a bull. If you are a bear, then you short and cover on the upward correction, taking a further short position into the final wave.
2. The wave must look right. If it does not, then look for a recount and continue to do so until the wave looks right.
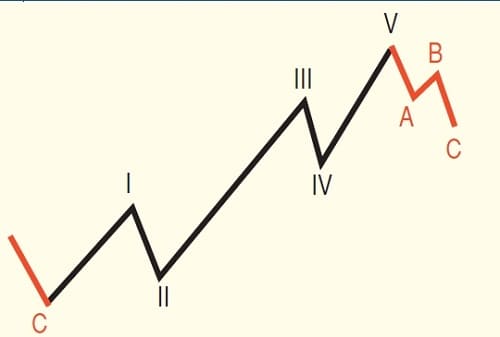
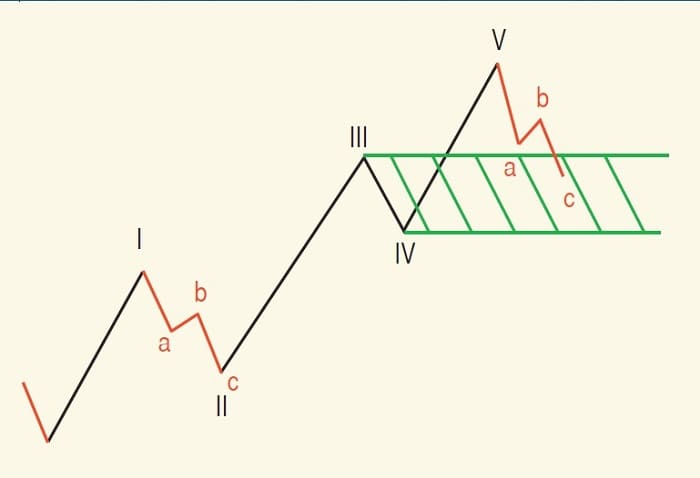
An Elliott wave chart is made up of eight waves, five waves up and three waves down (Figure 1). The waves are labeled 1, 2, 3, 4, 5, A, B, C. Waves 1, 3, and 5 are known as impulse waves, and waves 2 and 4 are corrective waves. In the ABC correction, I believe all the waves are a correction, simply because we cannot predict the height of wave B. Wave C, on the other hand, must end within the fourth wave of lesser degree. However, in a true bear market, the Elliott wave count can be reversed. In other words, an up moving impulse wave becomes a down moving impulse wave, and the ABC correction is then up. What is meant by “lesser degree”? See the sidebar “Wave categories.”
3.Wave 1 and wave 5 should be equal in length.
Wave 1 is a wave that forms after an ABC correction, and as such, in a major market correction, is more often than not considered by market traders and analysts to be a continuation of the bear market. This can be confusing, because in trying to identify a wave 1 after a C-wave correction, we are inclined to believe that it is a part of a wave of lesser degree within wave 5 of wave C. Wave 1 only reveals itself when it breaks above the downward moving trendline, and usually long after it has occurred. Most times it appears to become part of a complicated five-wave down move, and as a correction within that down move, moving more sideways with a gradual upward drift. One way to identify it is to look at indicators like the relative strength index (RSI), the moving average convergence/divergence (MACD), or stochastic to see whether an oversold position exists.
Suggested Books and Courses About Elliott Waves Method
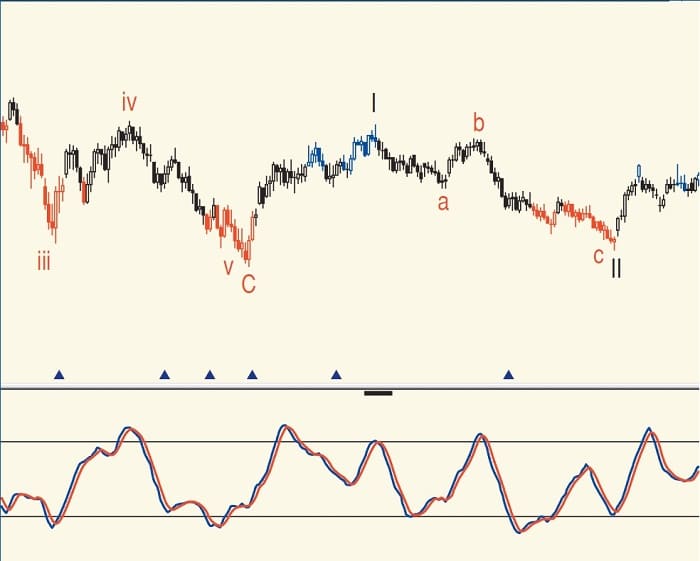
Figure 2 shows what a wave 1 looks like after a heavy and lengthy wave C and a possible continuation of wave C. You can see how it started off with a good solid retracement, but then tapered off into a sideways movement after forming a double top. There is no obvious five-wave impulse wave count within the wave, suggesting more of an abc correction count. The top of wave 1 could have been identified as a divergent sell by the indicator, and to make matters even more confusing, there is a far easier identifiable five-wave down count rather that the abc count I have shown.
WAVE CATEGORIES
The Elliott wave theory assigns categories to the waves, from largest to smallest:
- Grand Supercycle : 100 years plus
- Supercycle : 50 to 100 years
- Cycle : 1 year to 50 years
- Primary : Monthly
- Intermediate : Weekly
- Minor : Daily
- Minute : Intraday
- Minuette : 1 hour
- Subminuette : 30 minutes
If we are looking at a “cycle,” then wave C would end within the fourth wave of the “primary” and so on. The names are purely for identification, and as far as I am concerned, meaningless as such, because we can never be quite sure what cycle the count is in. Most Elliotticians regard the grand supercycle as being the “big one,” with the Great Depression being waves I and II, if that. For simplicity’s sake, I tend to ignore the naming of a wave, identifying a wave only as a wave of greater or lesser degree. I have shown time for the cycles I have listed, but they are not cast in stone. The cycles I find the most important are the monthly, weekly, and daily. All others are relative.
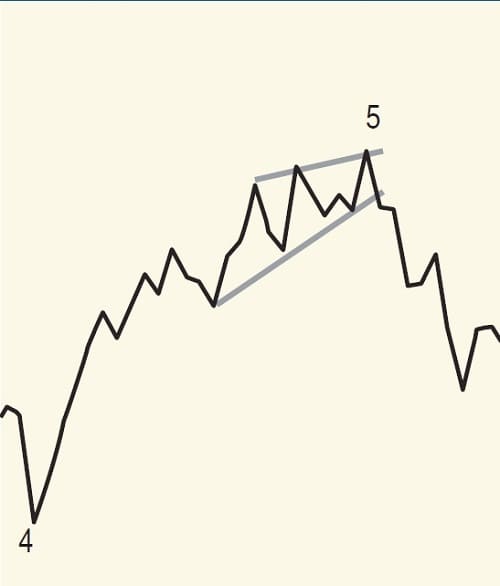
Whatever the outcome, the wave must look right, and that only occurred when a double bottom formed at the conclusion of wave II that was higher than wave C and identified only after the upward correction had already started. There are also times when wave 5 is greater than wave 1. This happens when wave 5 forms a rising wedge, as shown in Figure 3. The rising wedge also warns us that a correction is in the offing.
4. Wave 3 must be greater than wave 1. If wave 3 is less than wave 1, then wave 5 must be less than wave 3.
The rule says that wave 3 must be greater than wave 1. Actually, there are a number of rules for wave 3:
- Wave 3 can be equal to wave 1.
- Wave 3 can be a Fibonacci number greater than wave 1. This means that wave 3 can be much greater than wave 1, with many subwaves within it.
- Wave 3 can have a tiny “a-b” correction within it. When this correction occurs, it is usually found halfway in wave 3.
- Wave 3 can be shorter than wave 1. When that happens, then wave 5 will be shorter than wave 3.
Whatever the outcome, in a bull market with a strong economy, wave 3 is the major impulse wave in which assets appreciate constructively.
Suggested Book: Visual Guide to Elliott Wave Trading
5.If wave 2 is a simple wave, then wave 4 is a complicated wave, and vice versa.
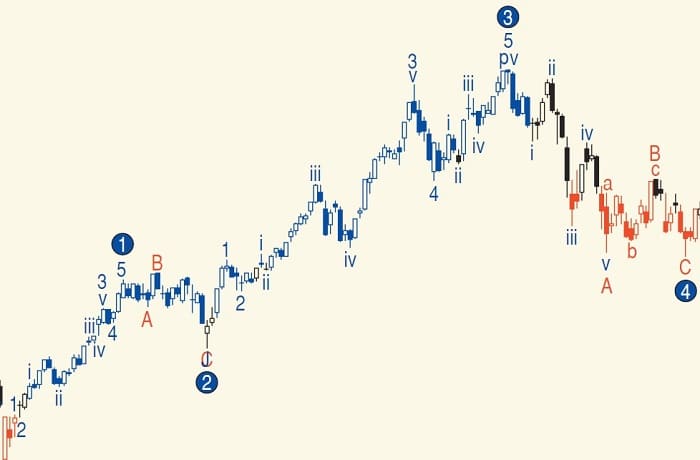
Figure 4 explains this rule. In the chart you can see that wave 4 is far more complicated than wave 2.
6.Wave 4 may not close below wave 1. If it does, then look for another wave count. Refer back to rule 2.
Wave 4 cannot close below the top of wave 1. If it does, then it means that a subwave has been created, and a simpler count must be done. This is shown in Figure 4 where wave 4, a very complicated wave, does not fall lower than wave 1, using that level as a support.
7. Wave C will correct to the fourth wave of lesser degree. In a minor wave, this rule may be broken when a major bear market/world recession occurs.
Figure 5 shows this clearly.
To keep things simple, this is always the rule. An A-B-C correction has the following rules shown in Figure 6:
- Wave A cannot bottom below the top of wave 3. If your count shows that it does, then it means that the ABC count could develop into a major bear count.
- Wave B can close at any level within or even above the high made by wave 5. If the latter occurs, then the C wave that follows could be a flat; it need not bottom below the low of wave A. Wave b can rise with an a-b-c internal count, or an a-b-c-X-a-b-c-X-a, and so forth. This count is only used if you want to be specific. I usually look for a simple a-b-c correction within wave B.
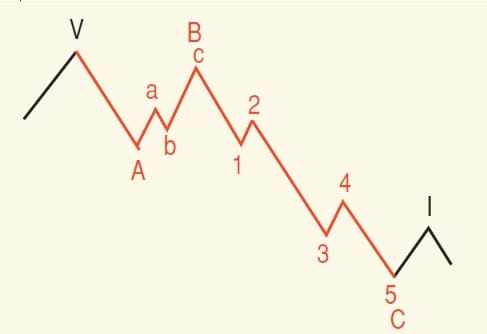
- Wave C falls in five impulse waves down. This is the usual count, but wave C can also fall in an a-b-c correction, rarely in an a-b-c-X-a-b-c correction as shown in Figure 7. When this occurs, wave C could be a simple abc correction, rather than a five–impulse wave down.
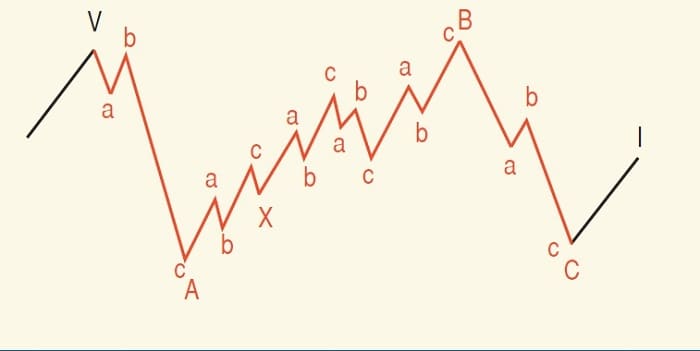
Figure 7 is even more complicated, because wave B is a complicated wave and reaches as high as wave V. This means that wave C will be a failure, and fall to or not much lower than wave A and an abc count.
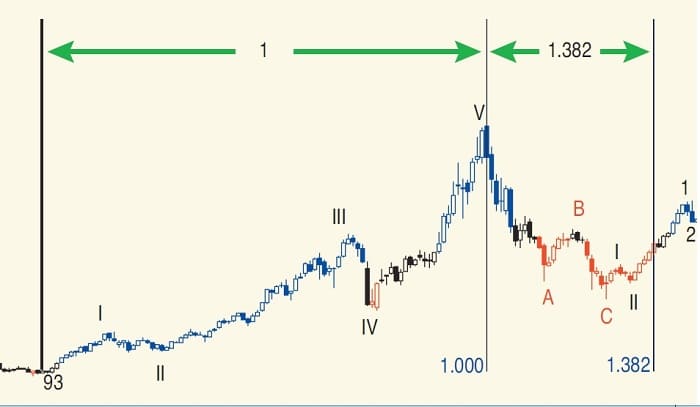
8. The corrective ABC wave should be, as far as possible, 38.2% of the time it took for the formation of waves 1 to 5.
If this rule does not occur, then it means that only wave A has been completed, with wave B still to follow. Figure 8 shows that the ABC correction is not quite 1.382 of the five-wave impulse rise, but close enough to be acceptable.
9. There are waves within waves within waves. Look for simplicity, and the obvious.
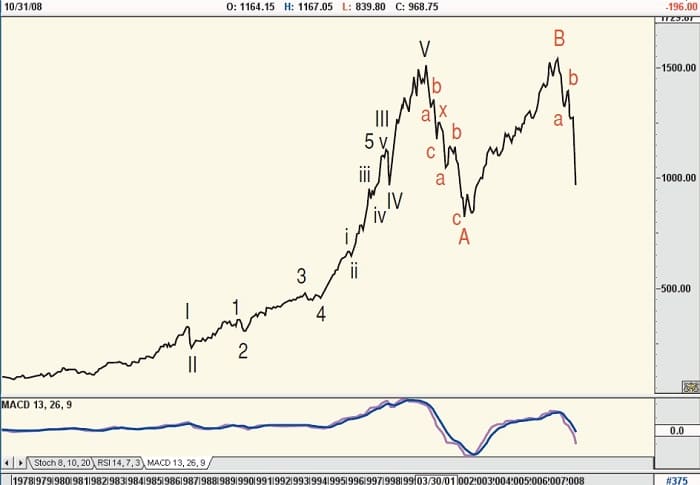
On the monthly chart of the Standard & Poor’s 500 (Figure 9) and the Dow Jones Industrial Average (DJIA) (Figure 10), note how both charts have differing wave counts, but the final result is a bear market. In Figure 9, as of October 31, 2008, the C-wave had not been completed. With the B-wave being as high as the A-wave, the forecast is that the C-wave will be flat, which means that it should not end below wave-A. But as I wrote in rule 1, Elliott wave theory is a signpost in the wilderness. The chart shows that the trend is down, but also suggests that the trend could reverse soon into a wave 1. Until that happens, I am a bear and the Elliott wave theory tells me to remain one.
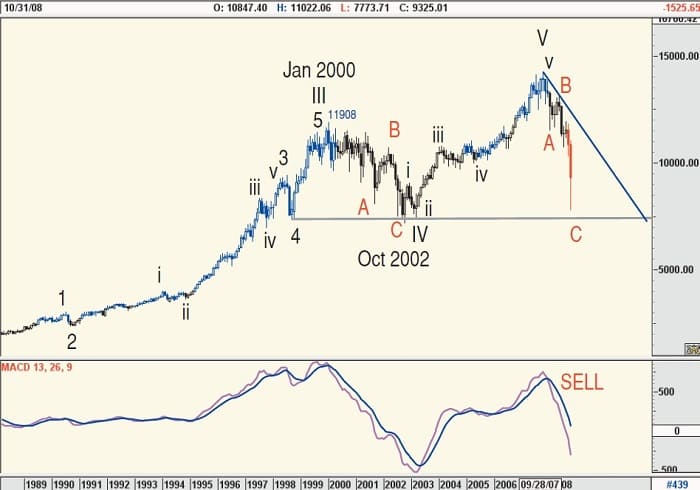
The chart of the DJIA (Figure 10), on the other hand, shows a wave 5 where the S&P chart is a wave A. Both counts are simple, and the most obvious for the chart. The only problem with the count of the DJIA, as shown in Figure 10, is that the ABC count looks as if it will not meet rule 10 — that is, the ABC wave will not be 38.2% of the time for the formation of waves 1 to 5. Time will tell which is the better count, but both have called a major bear trend. In both charts, the moving average convergence/divergence (MACD) may be the final decision maker.
KEEP IT SIMPLE
Look for simplicity in your count, and remember, the Elliott wave count is only a signpost to tell you where you are in the financial wilderness. Another signpost, a little further down the road, is always there. All you have to do is look for it.
Koos van der Merwe has been a technical analyst since 1969. He has worked as a futures and option trader and as a technician specializing in gold and gold shares.