Trading Articles
Elliott Wave, Price and Time Targets and the S&P By Robert Miner
In Jan. of 2000, the Dynamic Trading method of analysis and forecasting projected the S&P would make a final bull market top by March 2000 which would be followed by at least a three year bear market and the S&P price would be cut in half before the bear market was over. That is not an after-the-fact forecast but one that was specifically included in the Dynamic Trader Report in early 2000. The final top was made in March 2000 as projected. As of the date of this article, Feb. 2002, the S&P is well on the way to fulfilling the second part of the forecast for a continued bear trend to well below the Sept. 2001 low.
Let’s look at the current position of the S&P and see why the evidence is over-whelming for a continued bear trend. Chart A below is monthly S&P data from the Aug. 1982 low through early Feb. 2002. The bull trend from the Aug. 1982 low completed a textbook Elliott five-wave impulse trend where each of the interior impulse waves clearly subdivided into five-waves of lesser degree.
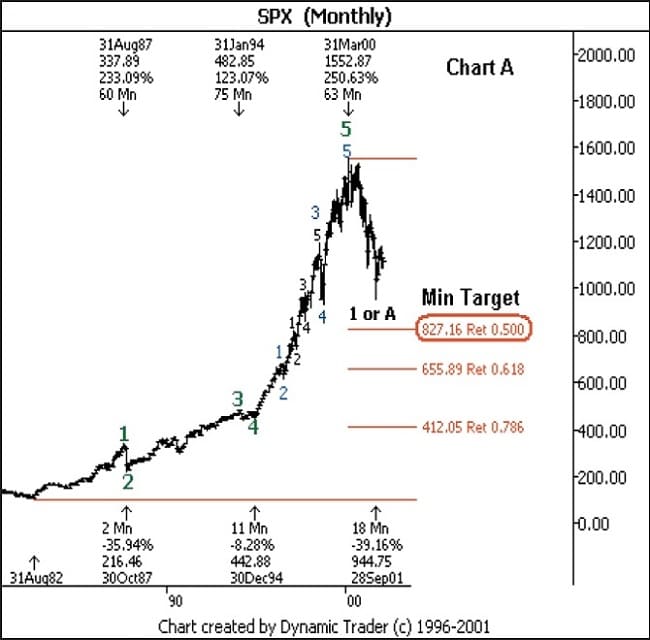
The bull trend from the 1982 low is not a “historical” bull market, but one of three similar bull markets made in the past century. Each had very similar time, price and pattern characteristics. The aftermath of this bull market is likely to be similar to the aftermath of the prior two bull markets with a prolonged bear trend lasting years, not months. In Elliott wave terms, the initial decline from the March 2000 high to the Sept. 2001 low is just a Wave 1 or A. From a trading or investing point-of-view, it does not matter whether it is a 1 or A. In either case, the S&P will eventually decline much lower. Chart B is a weekly chart of the S&P from the March 2000 high to mid Feb. 2002. The weekly chart shows the unmistakable five-wave decline. A Wave 1 or A should subdivide into five-waves. A correction should never be a five-wave impulse trend like the March 2000 to Sept. 2001 decline. This implies from an Elliott wave pattern perspective, the Sept. 2001 low should not be the end of a “correction” but must be just the first phase of the bear trend.
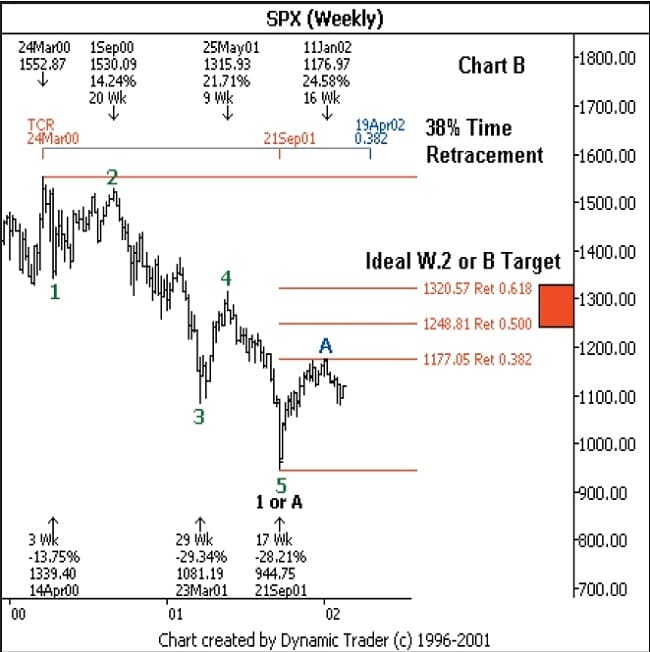
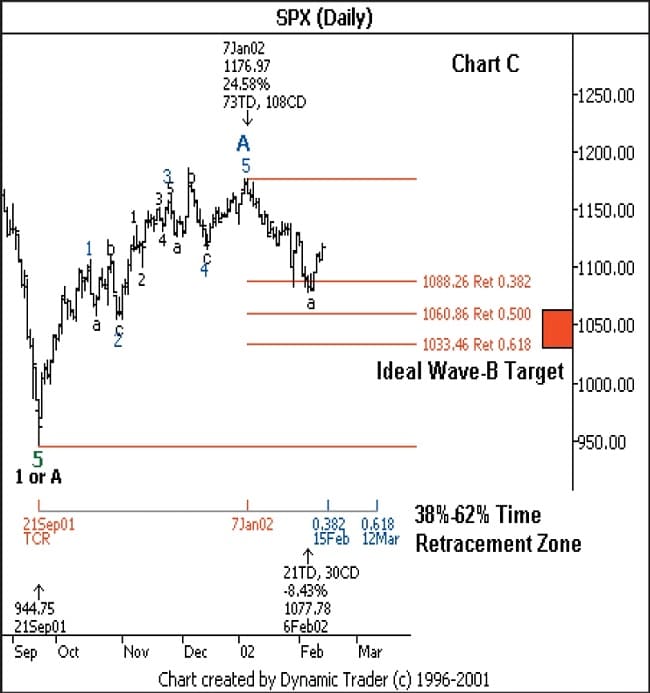
What typically follows a five-wave impulse trend? A correction greater in time and price than any correction within the five-wave trend that typically unfolds in an ABC pattern. As we will see from the daily chart, the Jan. high should only be a Wave-A of the ABC correction up from the Sept. 2001 low. The initial assumption is a correction to a five-wave trend should be a minimum of a 50% price retracement and 38.2% time retracement. The Jan. high fell short of both the minimum time and price targets which further supports the probability that the Jan. high is only the Wave-A high. If this is the case, the S&P should exceed the Jan. high before the corrective rally is complete.
Suggested Books and Courses About Elliott Waves Method
Chart C is the daily data from the Sept. 2001 low through mid-Feb. If clearly shows that the Sept. to Jan. rally subdivided into five-waves which is typical of a Wave-A. The Feb. 6 low had not reached the minimum time and price retracements to complete the Wave-B low so the assumption is it is not complete. Once the Wave-B low is complete, the S&P should complete a Wave-C rally to above the Jan. high to complete the larger degree correction before the long-term bear trend resumes to well below the Sept. 2001 low. Every thing appears to be falling ideally into place for a bear market corrective high in the second quarter of 2002 followed by a resumption of the bear trend into at least 2003 reaching a minimum of 827 and possibly much lower. Even if the S&P should vary from this ideal outlook, it would not invalidate the projection that Sept. 2001 should not be the bear market low. The bear market rally off of the Sept. low may take a more complex form or may top before reaching the Dynamic Trading minimum time and price targets but the bear trend should still have a long ways to go.
Fair Warning
Why have I stuck my neck out in print with such a specific forecast? One reason is that’s my job. It is what I have been doing since 1986 in my advisory reports. The integration of practical Elliott wave pattern analysis with my unique Dynamic Trading time, price and trend target analysis has served me well for over 15 years often projecting weeks and months in advance the minimum and typical time and price targets for trend of any degree.
A continuation of the stock market bear trend should coincide with many events that could be costly to readers. I want you to be prepared. A continued stock market bear trend should decimate many savings, investment, educational and pension funds for those who insist on staying invested for the “long-term” when a cash position is the only one that makes sense if the odds favor a continued bear trend. A continued stock market bear trend should coincide with a worsening recession where jobs, businesses and careers could be threatened, an increased level of military conflicts and increased level social conflict.
The analysis and forecast shown above are not meant to frighten anyone or suggest the world as we know it is going to disappear. The probable continuation of the stock market bear trend and deepening of the recession is simply the natural and inevitable outcome of the speculative excesses into the bull market top in 2000. If we are aware that it is the probable future, we can not only protect our capital, businesses, jobs and investments, but even profit by it from short sales and bear market mutual funds.
If the S&P continues to advance to above the Jan. high as projected, the overwhelming conclusion of the financial media will be the bear market and recession are over. Quite the opposite should be the truth. A continued rally above the Jan. high should be the ideal fulfillment of the bear market rally and quickly followed by a continuation of the bear trend. The next one-three years could be the most important in our lifetimes. It will clearly be a time to deal with realities and not hope and illusions. It could be a time of immense opportunity or of personal and financial disaster. Please remain alert, aware and make logical and rational decisions.
Robert Miner is the author of Dynamic Trading which was named the 1999 Trading Book of the Year. He publishes the Dynamic Trader Futures and Mutual Funds reports. His company Dynamic Traders Group also offers the Dynamic Trader Software and Trading Course.