Trading Articles
Dead-Cat Bounce Chart Pattern: Event Declines and Bearish Continuation
Intro
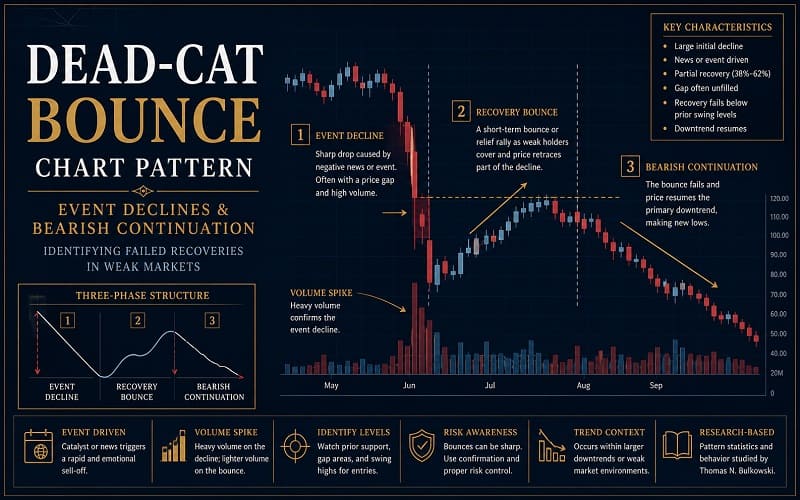
If you trade stocks long enough, you will probably run across this puppy: the dead-cat bounce. (I could not resist the pun). It acts as a warning to exit the stock quickly after a dramatic decline. The dead-cat bounce pattern (DCB) consists of three phases. First, the event sees prices decline over 30% in just a few sessions, the majority of the decline happening the first day. Second, prices bounce, recovering a portion of what they lost; and third, prices ease down, giving back all of their gains and more in the post-bounce decline.
Surprising findings include the following. If price gaps down on the first day, how long does it take for prices to rise far enough to cover the gap, that is, to close the gap? About half the time, the gap closes within 6 months, leaving half of all patterns still lower than where they started. After prices bounce, they move lower and over 75% make a low below that posted during the event decline. In many stocks, one DCB follows another, especially in a bear market. The final surprise is that DCBs with large event losses tend to bounce higher but take longer to peak than events with small losses.
If a dead-cat bounce occurs in a stock you own, ride price upward in the bounce and then get out. Prices will likely move lower and another DCB may await 3 or 6 months down the line. Do not trade any bullish chart pattern less than 6 months after a stock shows a DCB.
Tour
The name “dead-cat bounce” comes from the behavior of a stock after an unexpected negative event. Figure 54.1 shows a typical example of a DCB. In late September, the smart money started selling their holdings, driving down the price and pushing up the volume trend. Prices declined from a high of 42.44 to 35.81 in just over a week. On October 9, a major brokerage house lowered its intermediate-term rating on the stock. Down it went. In 2 days the stock dropped over 30%.
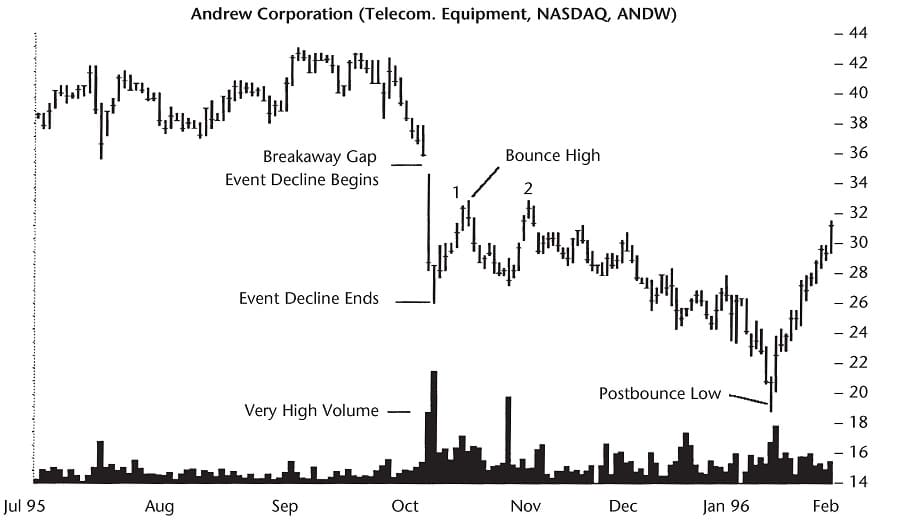
For the next week and a half, the stock recovered somewhat, rising to 32.81 and enticing novice investors to buy the stock. The stock moved lower and then climbed again to form a double top. This rise was the end of the good news. From the second peak, it was all downhill until mid-January, when the stock bottomed. From the high before the event began to the ultimate low, the stock plunged 50%! Welcome to the dead-cat bounce.
Identification Guidelines
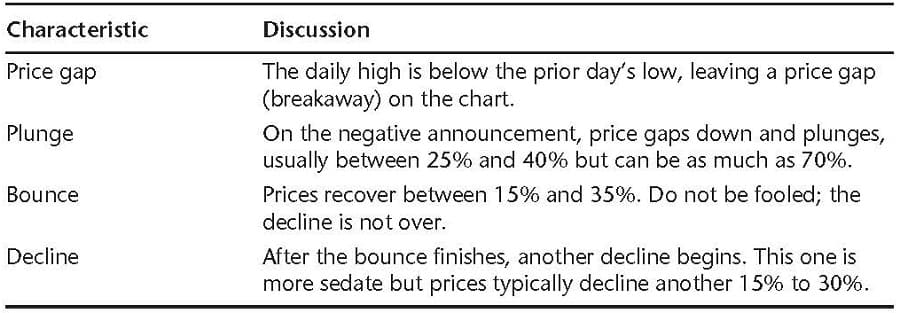
Are there characteristics common to the dead-cat bounce? Yes, and Table 54.1 lists them.
- Price gap, plunge. Suppose a company announces a negative event, usually when the market is closed. The news surprises stockholders and they line up to sell. The overwhelming selling pressure forces the stock to gap lower on the open. For this study, I used a minimum event decline of 15% but most ranged from 25% to 45% and one was as high as 78%. Imagine waking up to find a$10,000 investment worth just $2,200. The plunge usually takes 1 or 2 days, but the downward trend before price begins to bounce can last longer, up to 8 days.
- Bounce. Prices bounce up, recovering much of what they lost during the event decline. The recovery typically ranges between 15% and 35% and takes between 5 and 25 days to reach the top of the bounce.
- Decline. After price peaks during the bounce, it drops, falling slowly, until reaching a trend low 15% to 45% below the bounce top. It makes this journey in 10 to 50 days, usually.
To put the numbers into perspective, consider Figure 54.2, a 47%, 1-day decline. The Food and Drug Administration’s advisory panel rejected Cephalon’s Myotrophin drug application. When the news hit the Street, the stock gapped down and traded at almost half its value. Volume was a massive 8.4 million shares, more than 15 times normal. During the next 3 days, the stock recovered a portion of its decline by gaining $2 a share (low to high). Then the remainder of the decline set in. As if rubbing salt in the wound, the stock moved down again in an almost straight-line fashion. From the recovery high, the stock declined another 30%.
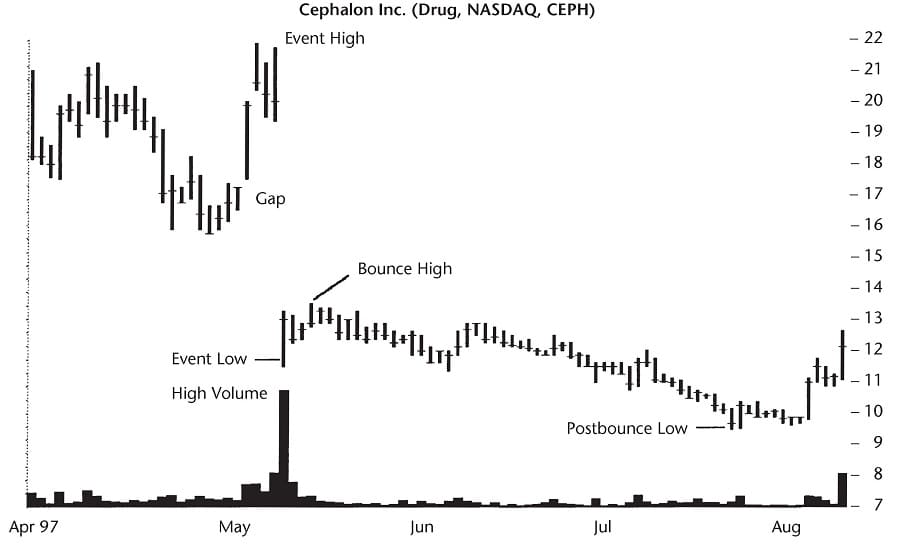
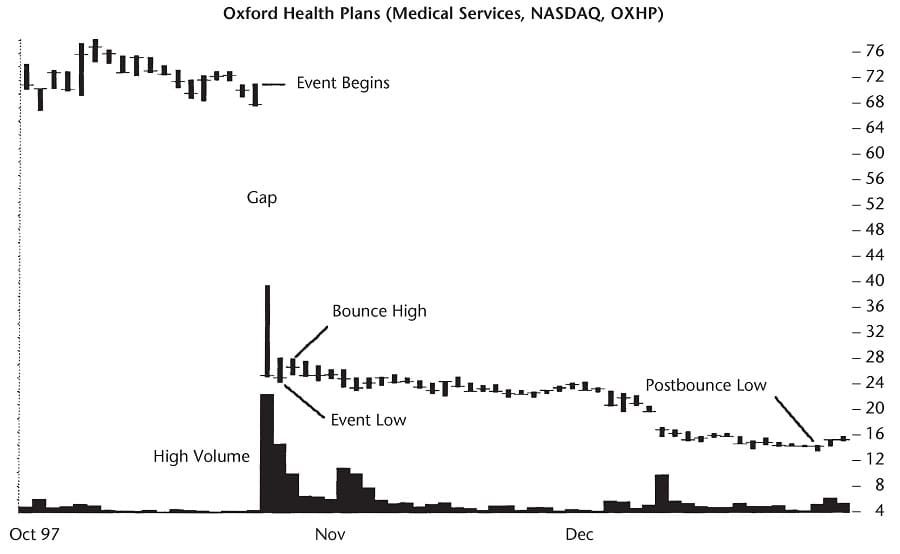
Figure 54.3 shows an even more alarming decline. Just 3 days before the massive decline, a brokerage firm reported that it believed the company would continue seeing strong sales and earnings trends. Perhaps this report boosted expectations, but when the company announced a quarterly loss—instead of the profit the Street was expecting—the stock dropped almost 43 points in 1 day. That is a decline of 62%.
The stock gapped downward, a characteristic that most DCBs share. A negative news announcement is so surprising that sell orders overwhelm buying demand. The stock opens at a much lower price. Volume shoots upward, typically several times the normal rate. Figure 54.3 shows that 49 million shares exchanged hands on the news, about 20 times normal.
Advanced Books and Courses By Thomas N. Bulkowski


Usually the 1-day decline establishes a new low and prices begin recovering almost immediately. Figure 54.3 shows that the stock made a new low the following day but then closed up a day later. After a massive decline, the bounce phase begins. Most of the time, a stock will rise up and retrace some of its losses. However, the bounce phase for Oxford Health Plans was brief—only 1 day. In less than 2 months, the stock dropped by half.
What types of events cause these massive declines? Almost all the events are company specific: negative earnings surprises, bad same-store sales numbers, failed mergers, accounting sleight of hand, outright fraud—that sort of thing. Sometimes the news affects more than one company. Figure 54.2 shows what happened to Cephalon, but Chiron stock was not immune. Chiron has a joint development and marketing agreement with Cephalon for the Myotrophin drug, so its stock also took a hit, but not nearly as large (less than 5%) as Cephalon.
Most of the time investors cannot predict the event. If you own the stock, you will lose your shirt. The question then becomes, how much of your remaining wardrobe do you want to lose? We see in the Trading Tactics section that it pays to sell quickly.
Focus on Failures
Not all massive declines end in a dead-cat bounce. Consider the event shown in Figure 54.4. On April 3, 1997, the company released earnings that fell short of expectations and announced that it terminated the merger with another company. Several brokerages downgraded the stock. Price tumbled 44%. Like all dead-cat bounces, the stock recovered. However, instead of bouncing up, then turning down and moving lower, this stock continued trending up. In less than 3 months, the stock recovered its entire loss.
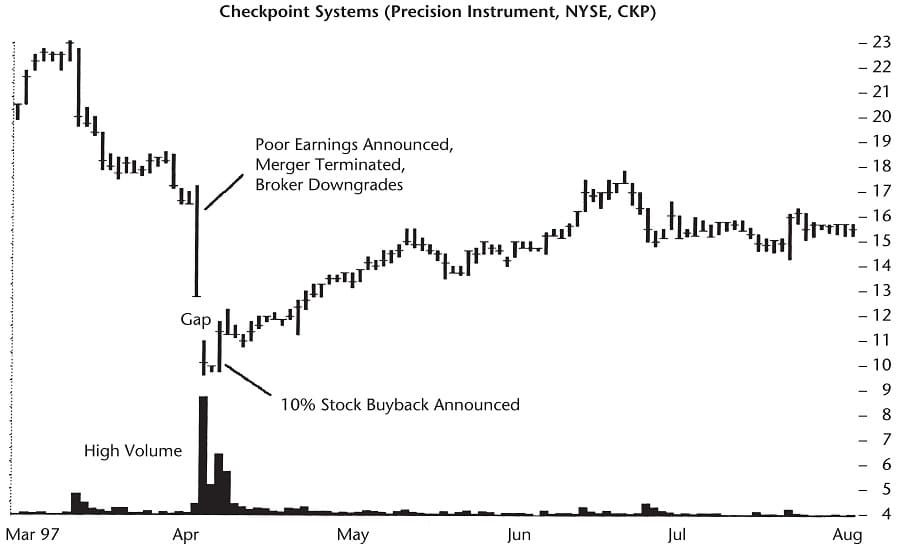
Why did the stock fail to bounce and head lower? Events that take place just after the negative news announcement explain the stock’s behavior. Several insiders bought the stock. Even the company got into the act and announced it was purchasing 10% of the stock. Together, the news sent the stock moving higher. Subsequent events kept the momentum building and the stock continued rising.
- Part of Book: Encyclopedia of Chart Patterns By Thomas N. Bulkowski