Trading Articles
Daytrading With Volatility By Mark Hodge

This trading strategy lets you take advantage of volatility to establish your profit targets and stop-losses. The term “volatility” is typically associated with losses. It’s easy for media and money managers to blame losses on volatile market conditions, but is that really the case? Higher volatility can mean greater risk, but greater risk is a direct result of greater price fluctuations in the market. Greater price fluctuations might be a concern for investors, but active traders need markets to move, and these price fluctuations are a necessary component for successful daytrading. So is volatility really that bad? Could you accommodate periods of greater volatility and lower volatility, and actually use volatility to your advantage with the markets you trade? Yes, you can!
DEFINING VOLATILITY
Simply, volatility is the degree of uncertainty, and it is the potential for price changes in a given market. It can be defined in various ways, but the CBOE Volatility Index (VIX) is a great gauge of volatility in the US markets. VIX measures volatility on the Standard & Poor’s 500, based on 30-day option premium. When option premiums are high, traders expect future volatility to be high, and VIX rises. When option premiums are low, traders expect future volatility to be low, and VIX drops. VIX might be a great way to gauge volatility in the US markets, but how can you identify and track volatility in the individual markets you trade? This can be accomplished by tracking the actual ranges that a security or market has traded in a given period of time. This can be examined in a few ways.
Let’s begin by introducing average true range (ATR). ATR is an indicator that measures a security’s or market’s volatility. ATR was created by J. Welles Wilder and introduced in his New Concepts In Technical Trading Systems. To determine the “average” true range, you first need to calculate the true range of a market. True range is defined as the greatest of the following:
- The current high less the current low (range)
- The absolute value of the current high less the previous close (true high)
- The absolute value of the current low less the previous close (true low).
The formula is:
True range =
MAX (|High(today) – Low(today)|,
|Close(yesterday) – High(today)|,
|Close(yesterday) – Low(today)|)
By taking the greatest of these values, Wilder’s goal was to account for gaps and potential limit moves in commodities. Once you understand how to determine the true range of a market, it is easy to calculate the average true range by taking a simple moving average of the true range for specified periods. When used as an indicator, the standard setting for average true range is 14 periods. Although a 14-period ATR setting is standard, active traders might want to consider a smaller time frame for intraday trading. As with any indicator, the more periods you use, the smoother the average and more representative the indicator is of the longer trend. The shorter the period, the more responsive, and the more representative the indicator is of the immediate trend. In volatile periods a market will have a higher ATR, and in calm periods a market will have a lower ATR. Once you have the ATR of a market, you have a better understanding of recent volatility in the market(s) you are trading.
AVERAGE DAILY RANGE
An alternative to the average true range is the average daily range (ADR), popularized by trader Markus Heitkoetter, author of The Complete Guide To Daytrading. The ADR takes the difference between the trading session high and low, averaged over a seven-day period. The formula is:
Average daily range =
(|Session high(yesterday) – Session low (yesterday)|
+ |Session high (2 days ago) – Session low (2 days ago)|
+ |Session high (3 days ago) – Session low (3 days ago)|
+ |Session high (7 days ago) – Session low (7 days ago)|) / 7
ADR does not factor in gaps and is best used in markets that do not experience consecutive limit moves in price, which was Wilder’s original concern when he introduced ATR in the 1970s. However, ADR is easy to use and effective for futures traders who trade electronic markets but focus on trading in open outcry sessions. These sessions are standard trading hours when pit and electronic trading are conducted simultaneously (such as 9:30–16:15 Eastern time for the emini S&P 500). Because the average true range takes gaps into consideration and average daily range does not, the ADR will have a smaller value between the two and be more representative of volatility in the actual daytrading session.
TRADE MANAGEMENT
Whether you prefer a market’s ATR or ADR, you can use recent volatility in the market you are trading to set targets and stops. This is most easily done by using a percentage of volatility for your stop-losses and profit targets. By using a percentage of volatility for exits, targets and stops can expand and contract depending on current volatility and market conditions. In volatile periods, stops and targets based on the percentage of volatility will be larger. In quiet conditions, stops and targets based on a percentage of volatility will be smaller. You will risk more and make more when markets are more volatile, and you will risk less and make less when markets are quiet. This is a great way to take advantage of opportunities in a market when there is fluctuating volatility like we have experienced in the last year.
Suggested Books and Courses About Day Trading
With the extreme volatility that was experienced in autumn 2008, followed by the lower volatility that we are experiencing at the current time, many traders who are not considering volatility for targets and stops have struggled. Once you’ve determined the ADR, you can calculate conservative exits for daytrading by using 10% of the ADR as your stop-loss and 15% of the ADR as your profit target. Although I am concentrating on exits in this article, feel free to test any trend-following daytrading strategy with percent volatility stops and targets.
APPLYING THE ADR
Let’s say you use a seven-day ADR to determine targets and stops. For example, take the emini S&P 500 at the end of the day on June 30, 2009. To calculate the ADR and your stop and target for the next trading day, you need the following information:
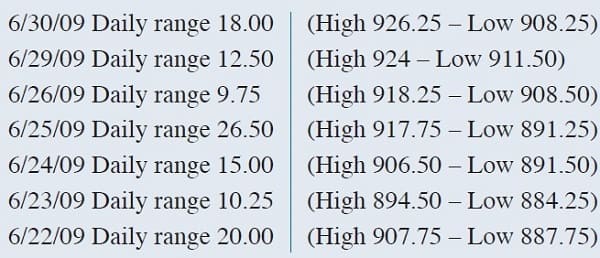
- Total 7-day range = 112 points/7 = 16 ADR
- Stop-loss 10% of 16 ADR = 1.60 (rounded to 1.50)
- Profit target 15% of 16 ADR = 2.40 (rounded to 2.50)
Based on the current 16-point ADR, you should consider using a 1.50-point stop-loss and a 2.50-point profit target. Because the range of each trading day will change, the ADR will change too. This means it might be necessary to adjust your targets and stops daily. These adjustments will help you accommodate current market conditions by using appropriate targets and stops in the markets you trade. Using the emini S&P 500 again, let’s take the ADR from the close of October 24, 2008, as our next example. On this day, the VIX was at its highest level since it first started being tracked by the CBOE, indicating extreme volatility in the US markets:
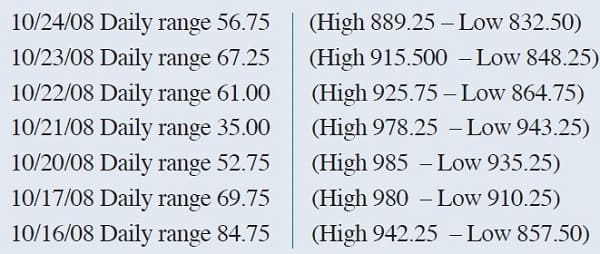
- Total 7-day range = 427.25 points/7 = 91.75 ADR
- Stop-loss 10% of ADR = 9.175 (rounded to 9.25)
- Profit target 15% of ADR = 13.7625 (rounded to 13.75)
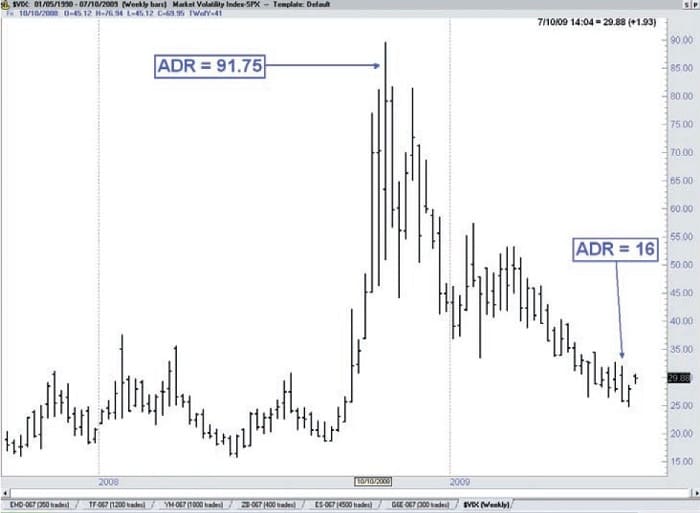
Taking a look at a weekly VIX chart in Figure 1, you can see how volatility has increased and decreased over the last year, making some strategies difficult to trade. The first thing you’ll see is the substantial difference between profit targets and stop-losses from October 2008 to June 2009. This is the beauty of using percent volatility targets and stop-losses. It wouldn’t make sense to continue to use a 13.75-point profit target for daytrading in June 2009 if the entire daily range were only 16 points. On the flipside, it would have been challenging to use a 1.50-point stop-loss back in October 2008, when 1.50-point moves occurred by the minute.
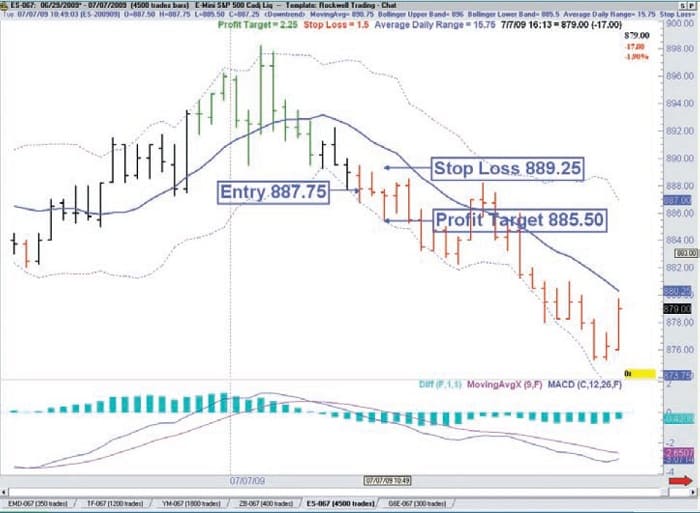
Now, analyze a real example trading the emini S&P 500. On July 7, 2009, the ADR was 15.75. Using 10% of the ADR (15.75 x 0.10 = 1.57, rounded to 1.5) as our stop, and 15% of the ADR (15.75 x 0.15 = 2.36, rounded to 2.25) as our profit target, we are looking for a 2.25-point profit target and a 1.5-point stop-loss when we enter the market. In Figure 2, we’re using a 4,500-tick chart on the emini S&P 500. Downtrend bars are highlighted in red when the moving average convergence/divergence (MACD) is below the signal line and the zero line, and uptrend bars are highlighted in green when the MACD is above the signal line and above the zero line. To keep things simple, we’ll enter a short position at the close of the first bar when the MACD is showing a confirmed downtrend (a red bar) at 10:19 ET based on the criteria discussed. With an entry at 887.75, the 10% ADR stop-loss is 889.25 and the 15% ADR profit target is 885.50, which is hit a few bars later for a winning trade.
TRADING VOLATILITY
Using volatility to establish profit targets and stop-losses, you can make sure that your exits are appropriate for all market conditions and periods of unusual volatility. Knowing when to take a loss and when to take a profit are crucial to the success of a daytrader but making sure that your exits are appropriate for the market conditions you are trading is just as important. Using percent volatility stops and targets based on the ADR is a simple solution for any market that all daytraders can incorporate into their trading plan.
Mark Hodge is an independent trader and head coach at Rockwell Trading. Hodge has traded all markets and time frames but specializes in short-term futures trading. He is the coauthor of Rockwell Trading’s Home Study Course and conducts private coaching sessions with active traders around the world.