Trading Articles
CompuWave: Elliott Wave, Fibonacci Targets, and Indicators
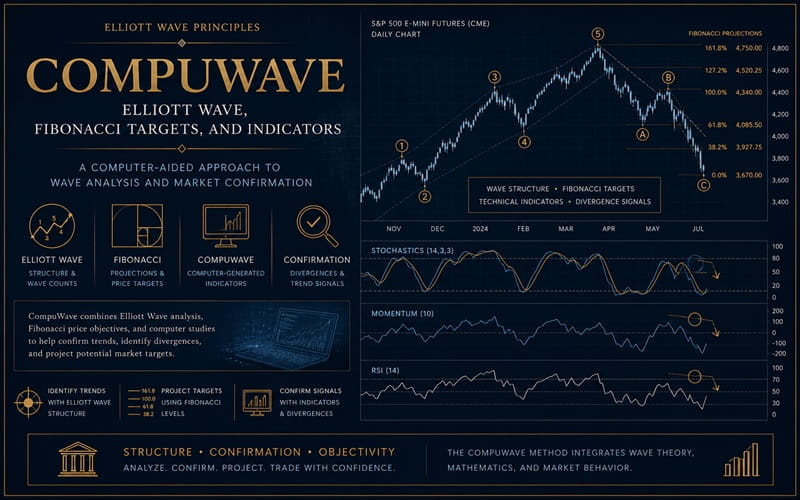
The purpose of this article is to outline how COMPUWAVE analysis is profitable applied to the markets of the 80’s. Compuwave combines the projections of Elliott Wave analysis with today’s computer generated technical studies. The ideal markets to apply COMPUWAVE are those with large volume and broad public participation, so that mass psychology is represented in market moves. The U.S. Treasury Bond futures and the stock index futures markets stand out with these characteristics. Compuwave analysis can be applied to all time frames, from monthly down to intraday price swings.
Elliott Wave Analysis
The great advantages of Elliott Wave analysis are that the technician can anticipate market moves in a given wave structure and he can project amazingly accurate Fibonacci price targets. This allows him to construct trades, using the Elliott rules and guidelines, with well defined profit objectives and risk points. Even with these obvious advantages, Elliott Wave analysis does have limitations. The rules and guidelines are flexible enough to allow many different wave counts to be attached to a given market situation. The technician must look for all the possible counts, pick the most likely one by fitting the count into the next higher degree, and by determining the proper “wave personality.” Determination of wave personality through market strength and weakness is where the computer generated studies can be applied. They will confirm the current count being used, or they can aid in the selection of the proper wave count from all the alternates.
The first set of COMPUWAVE tools are those used for standard Elliott Wave analysis. This begins with the hourly close-only charts of the futures and cash markets. The most actively traded 30 year U.S. Treasury Bond, S&P, NY Composite, and DJIA indexes are the cash markets to chart. Intraday 5, 15,30, and 60 minute bar charts are used to match the intraday price ranges with the hourly dots so that accurate Fibonacci price targets can be generated. Price targets for stock indexes are best calculated with the price swings, since the widely fluctuating futures premium causes wave overlaps or unreliable targets. Waves of larger degrees are counted on the daily, weekly and monthly charts. Cycles and bullish consensus figures offer additional support to the wave counts.
After using the standard Elliott Wave tools, wave confirmation or wave selection can now be greatly aided by the following computer generated technical studies: Slow Stochastics, Percentage of Range, Momentum, and Relative Strength Index. These mechanical studies will indicate when the market is overbought or oversold. Peaks of first, third, and fifth waves, and B wave rallies should give overbought readings on these studies. Second or fourth wave corrections and C waves within those corrections should give oversold readings. The studies also provide valuable divergence information. Third wave rallies should have the highest momentum in a five wave impulse. When the fifth wave rally arrives, Stochastics and Momentum peaks that are lower than where they were for the third wave will help confirm that the market is actually peaking a fifth wave.
After experimenting with many time periods to build the technical studies, 13 periods seem to offer the best signals. The slow Stochastics indicates an overbought condition when the k line crosses the d line in the area above 80 percent. Oversold is indicated when the lines cross in the area below 20 percent. The Percentage of Range indicator is best used as an oversold measure, when it moves above 95 percent. The Momentum indicator is best used to note divergences between waves. The RSI gives indications of being overbought at readings of 80 or above, and indications of being oversold at readings of 20 or below. Rate of Change, quite similar to Momentum, is also a useful study.
It is important to do the Elliott Wave analysis first, and then look at the technical studies afterwards. Initial wave analysis will provide a count or a few counts that have specific price targets attached to them. The mechanical studies will then aid in selecting the proper count, and a well defined trade can be constructed. Looking at the technical studies alone will give the technician an idea that a trend reversal is coming, but he will have no idea at what price to expect such a reversal.
When using the technical studies against the wave counts, be sure that the time frames of the studies are consistent with the degree of the waves. For instance, doing wave analysis on the hourly close only and hourly bar chart implies that the technical studies should be done on the hourly bar chart. In fact, at fifth wave rally peaks or bottoms on an hourly wave count, confirmation will often come with the 60, 30, and 15 minute technical studies all registering overbought or oversold at the same time. Common situations where COMPUWAVE analysis can be applied are shown in the following:
1.Upside and Downside Gaps
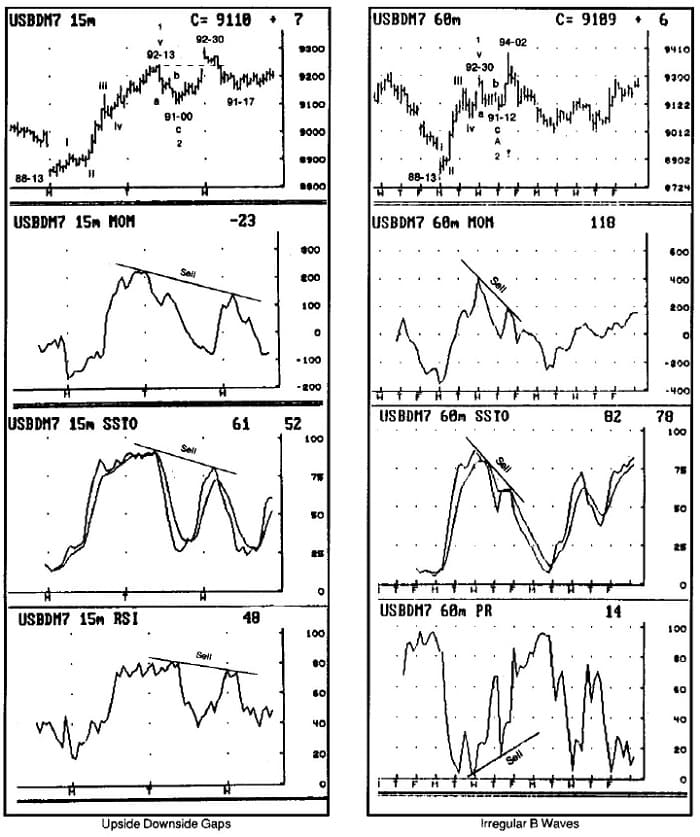
Daily price gaps provide very useful information regarding the current count. For this article, a daily gap is defined as a morning opening above or below the previous day’s range – excluding any evening or foreign trading. A gap that remains open during the trading session helps confirm that the market is in the third wave of an impulse, and trading in the direction of the gap carries a high degree of success. However, if the gap is filled during the day the follow-through is often very swift. *In this example the Bonds appeared to have counted five waves up from 88-13 to 92-13, completing a larger wave 1. A corrective three wave move to 9 1-00 was four ticks shy of a 38 percent retracement, and a rally to 92-08 into the close followed. The market was ideally set to gap up into a third wave. A look at the Stochastics showed that a buy signal was given for the two wave pullback. The next morning the market gaped above 92-13 by opening at 92-28, but the Stochastics, Momentum, and RSI were diverging with the peak at 92-13. This indicated that the gap must remain open to keep the market in the third wave. Therefore, whether long or not, a sell stop at 92-12 allowed the trader to catch a swift move to 9 1-17 as the gap was filled. The gap turned out to be an exhaustion fifth wave gap to 92-30, and the low at 9 1-00 was labeled as a fourth instead of a two wave.
Advanced Books and Courses on Elliott Wave Theory

2. Irregular B Waves
Once a market makes a five wave advance completing a larger one wave, and then completes a three wave correction, the ensuing rally should be either a third wave or a B wave. A third wave will normally announce itself with a gap-up opening. In the absence of a gap, when the rally starts carrying above the previous fifth wave peak, the computer generated studies can help determine if the rally should be aggressively bought as a third wave, or if it is simply a B irregular false breakout. This example continues the previous one, which ended in a fifth wave exhaustion at 92-30. The following three wave decline to 9 1-12 could have been labeled as an A or 2 wave. The sharp rally from 91-12 definitely had the appearance of being a third wave.
However, the Momentum and Stochastics studies clearly showed strong divergences between this rally and the fifth wave peak at 92-30. Note also the divergence on the Percent of Range study. These divergences helped identify the move to 94-02 as a B irregular, which would now lead to expectations of a C wave destined to undercut the A wave at 91-12.
3.Diagonal Triangles
This example continues the previous two with the Bonds having peaked a B irregular at 94-02. The expectation now would be for a five C wave to undercut the A wave at 91-12 and find support at a Fibonacci target. The standard 38 percent and 62 percent retracements of the five wave rally from 88-13 to 92-30 were 9 1-07 and 90-04. As the Bonds declined, each leg down took the form of three waves and the ranges began contracting. This led to the possibility of a diagonal triangle, which occur in the fifth wave or C wave positions. Since alternate legs of triangles are normally related by 62 percent, another target for the termination of the C wave could be generated. The third wave of the triangle went from 92-16 to 90-26, a move of 54 ticks. Sixty-two percent of this move, subtracted from the fourth wave at 91-14 yielded a target of 90-13. Since the 38 percent retracement had already been violated, the target range for the end of C was 90-13 to 90-04. Now the computer generated studies would confirm the Elliott Wave targets. The Percentage of Range study peaked at 96 mid-day on Monday, while the Stochastics study generated a buy signal after the opening on Tuesday. The C wave ended just before Monday’s close, right into the target range at 90-12. Note also the divergence in the Momentum on the way down.
4. The 4th Wave
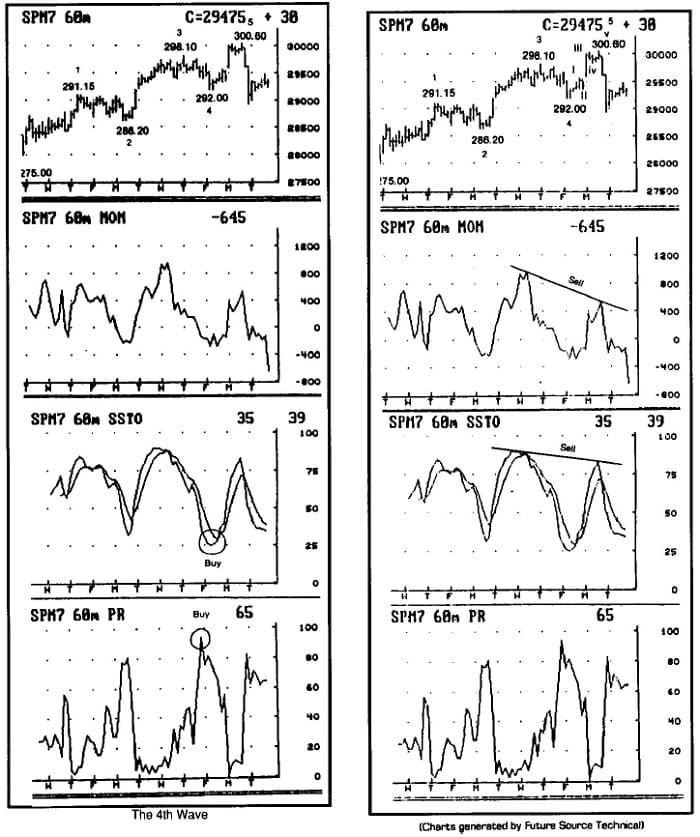
One of the most structured trades that Elliott Wave analysis can offer is buying a 4th wave against the top of a 1st wave. Since a 4th wave should never overlap the 1st wave, once the bottom of the 4th wave is targeted the risk becomes the distance between the target and the top of the 1st wave. The profit objective will be to liquidate above the peak of the 3rd wave. In this example the S&P rallied in a 3rd wave advance from 275 to 298.10, and it appeared to have potential to turn into a 5th wave rally. The targets for a 4th wave pullback were 293.55 for a 38% retracement of the 3rd wave, and 293.15 where the 4th would have equality with the 2nd wave. As the market came down into the target area, a look at the computer generated studies helped confirm that the decline was a 4th wave, even though it exceeded the target area by moving to 292. The Percentage of Range peaked at 94 into the close on Thursday, while Stochastics were entering an oversold area. Going long in the target area or below would require a stop at 291.10, just below the peak of the 1st wave, with an objective to liquidate above 298.10. The Stochastics further confirmed the 4th wave as it gave a buy signal during Friday’s trading. The cash market also held much better against its 1 wave, giving the trader encouragement.
5. The 5th Wave
5th waves, as the final moves in an impulse, are clearly confirmed by the computer generated studies. The most powerful part of an impulsive move is located in the 3rd wave, while the 5th wave should be expected to be less dynamic. This difference in momentum in the two waves is exhibited by divergences in the Momentum and Stochastics studies, as shown in this example. After have bought the 4th wave in the previous example, the emergence of a 5th wave is confirmed by the studies as the diverge into a move above the 3rd peak at 298.10. The maximum that this 5th wave was expected to go was 303.90, since it could not be larger that the 3rd wave (which was smaller than the 1st wave). Once the market was above 298.10 though, the 5th wave could terminate anywhere between there and 303.90. This particular 5th wave was subdividing into 5 waves itself, with the peak of its 3rd wave a 300.25. So attempting to exit on a 5th of a 5th above 300.25 was perfect as S&P rallied one last time to 300.60.
Traditional Elliott Wave analysis is in itself a very powerful tool. Now the availability of the high speed computer’s technical studies makes wave analysis even stronger. The objectivity of the studies helps to bring wave analysis to a more scientific stage by reducing some of the uncertainties in proper wave selection. The COMPUWAVE combination of wave analysis with the computer studies’ confirmations produces trades that have the highest probability of being profitable. Nothing could be more straightforward than having a 5th wave target met along with the 60, 30, 15, and even 5 minute studies all at their extremes to exit the impulse and position yourself for the correction.
The examples presented in this article are just a few of the many instances where COMPUWAVE can be applied. Elliott Wave patterns are constantly in the process of unfolding. Careful attention to the weekly, daily, hourly close only and intraday charts for wave counts, supported by extremes and divergences on the computer generated studies, will produce a great number of structured trades with Fibonacci price projections and wave guideline risk points. It is often said that “they don’t ring a bell at the top,”, but COMPUWAVE should help ring its own bell for you.