Trading Articles
Combining RSI With RSI By Peter Konner
Optimization and stop-losses can help you minimize risks and give you better returns. You would like to be long in a market that’s trending up, but what about when the trend turns down? Do you exit and just watch from the sidelines, or do you try to trade on the corrections in the downtrend? Here’s a simple combination where you can trade long-term uptrends and short-term corrections, all in one chart.
INTRO
One of my previous strategies didn’t allow me to enter a trade and stay there in a long and strong uptrend, since the strategy was designed to use the relative strength index (RSI) on a daily basis. The total return from my RSI strategy was fair, but there were many trades with little return, especially in volatile markets.
I decided to build a new strategy with these requirements:
- The strategy should be based on a single model or indicator to keep it as simple and transparent as possible.
- It should be designed for weekly trading. I have a full-time job and can only spend time analyzing stocks on the weekends.
- The need for subjective analysis of charts and formations — such as support lines, channels, and so forth — should be kept to a minimum.
- The strategy should be designed to stay long in an uptrend but also trade on the corrections in a downtrend.
- Its implementation should be fairly simple.
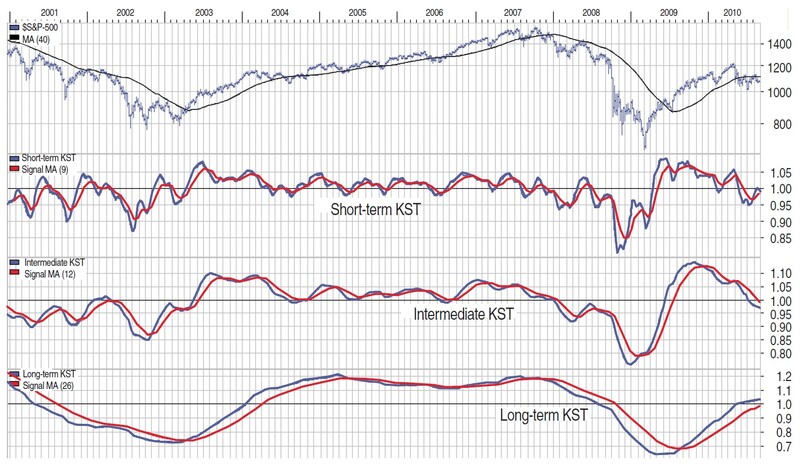
Technician Martin Pring’s KST (“know sure thing”) indicator comes in three different setups — short term, intermediate term, and long term — and is designed for weekly data. The three setups try to model the market waves of three different periods where short term is between three and six weeks, intermediate term is between six weeks and nine months, and the long-term trend is between six months and three years. Figure 1 shows a bar chart of the Standard & Poor’s 500 and the three KST indicators.
TWO RSI
As I mentioned, my previous strategy was based on a daily RSI. I have used the RSI for quite a few years and due to my familiarity with it, I wanted to build a model using the RSI on a weekly basis instead of a daily one, as in my previous strategy. I also wanted to adapt the KST idea of an indicator that works with more than one time span and follow the market waves of both an uptrend and a downtrend.
The RSI measures the ratio between the upward movements of price and the sum of all movements during a given period. When an RSI is between 40 and 80 (Figure 2), a stock is normally in an uptrend (B), and when the RSI is between 60 and 20, the stock is in a downtrend (C). The stock exits the downtrend when the RSI passes above 60 (E) and enters the downtrend again when the RSI goes below 40 (F). Finally, the A and D zones signal an overbought (A) or oversold (D) level of price.
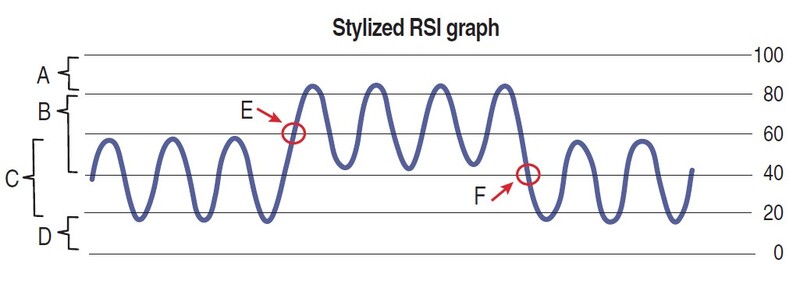
Instead of 60 and 40, I normally use the 61 and 39 levels to confirm that the change in trend really has happened. With the RSI, the common rule of trading is that if the RSI exits above the downtrend area (Figure 2: E) and price rises above a certain moving average, you have a buy signal. If the RSI falls below the uptrend area (Figure 2: F) and price falls below the moving average, you have a sell signal.
Suggested Books and Courses About Market Indicators


Since I like to keep things simple and transparent, I will create my model using a simple setup of two RSIs in one chart based on two different time periods. I will call these indicators slow RSI and quick RSI. Whereas the KST consists of other indicators that are summed, weight adjusted, and smoothed, I want this RSI to be simple and transparent to start with. I have done an initial optimization on the two RSI indicators and the moving average of the price. The optimization suggests that on a weekly chart, the period of the slow RSI should be 17 weeks and the quick RSI should be five weeks. The slow and quick moving averages of price are set to 40 and 10 weeks.
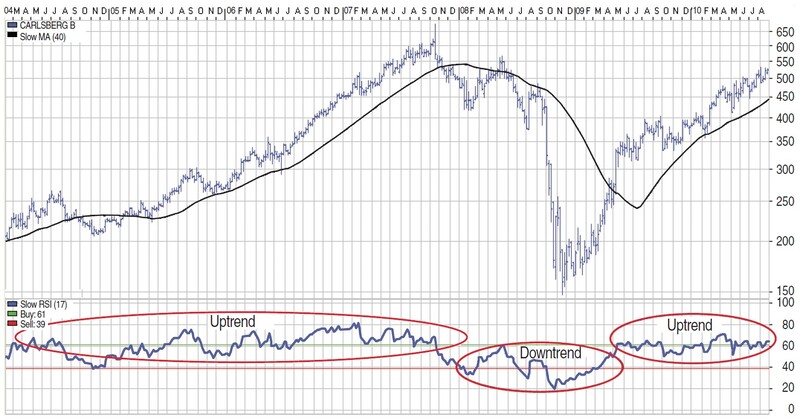
Let’s focus on the slow RSI first. As you can see from the monthly chart of Carlsberg in Figure 3, the slow RSI follows the trend up and down. It moves between 40 and 80 when price rises (January 2005 to December 2007) and it falls to the 60/20 area in January 2008 when prices start to fall. In May 2009, the RSI again moves above the 60 level, indicating that the stock is back in an uptrend. These three periods are emphasized in Figure 3 with circles in the RSI area.
From February through May 2008, the price rose some 30% from about 420 to 560. The slow RSI is still showing a downtrend in price, but you want this model to react to a minor upward correction or short-term uptrend as well. Consequently, I added the quick RSI in the same chart as the slow RSI, as shown in Figure 4.
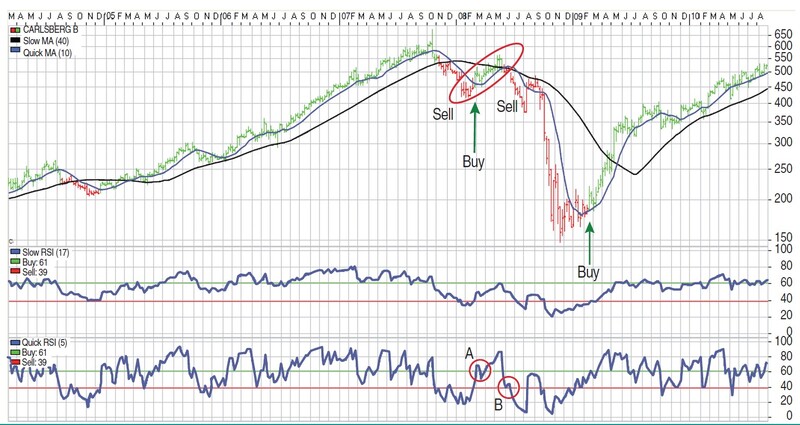
In Figure 3 you see the slow RSI moving in the uptrend area (40–80) until late 2007. We were, of course, long at this time. In November 2007, price fell below its 40-week moving average, and shortly thereafter, the slow RSI shifted below 40 and started to oscillate between 20 and 60 (also known as the downtrend area).
We sell at this point or go short, and wait for the quick RSI to take over. This happens in February 2008 (Figure 4: A), where we buy at roughly 460. After 13 weeks, the quick RSI went below 40 again (Figure 4: B). We sell at 520, thus making a gain of 13%. The next long-term buy signal from the slow RSI is given at 290 in early May 2009; we had bought at 185 in February because the quick RSI signaled another correction, one that just happened to be the start of a new uptrend.
SLOW VERSUS QUICK
First of all, the analysis should be based on a weekly chart. The first part of the strategy is used by many traders (see Figure 2):
- Buy when the slow RSI (17w) rises above its 60-level and the price is above its 40-week simple moving average.
- Sell when the slow RSI (17w) falls below its 40-level and the price is below its 40-week simple moving average.
This makes you stay long in an uptrend, and out in a downtrend. During a downtrend — as defined by the slow RSI (17w) — it should be possible to trade the minor corrections, although you should be aware you are trading against the main trend. Thus, I expand the strategy. If the slow RSI (17w) signals a downtrend:
- Buy when the quick RSI (5w) rises above its 60-level and the price is above its 10-week simple moving average and the slow RSI (17w) signals a downtrend.
- Sell when the quick RSI (5w) falls below its 40-level and the price is below its 10-week simple moving average.
For my purposes, I have developed the model for Avanza-Vikingen, a technical analysis program used by many traders in Scandinavia. The model, which I have named Riviera, can be downloaded from my website at http://www.pointfigure. dk. You will find the source code in the “RSI With RSI.” In the code, I have modified the exit by using an “OR” statement. This is merely because it gives a quicker exit. You can use either “AND” or “OR” conditions for the exit.
THE RIGHT PARAMETERS
Every technical indicator has its own personality. A trading system with a single indicator is obviously more transparent than a system with four to six indicators, since you only have to become familiar with one.
In this article I have used the RSI, but if you prefer KST, stochastic, the moving average convergence/divergence (MACD), or anything else, the concept of using one indicator on two different time periods in the same trading system can be applied to any of these. Finding the right parameters is always difficult. The optimization in this example was only done on one time period and only with 20 different stocks. Before using this system in real-world trading, you need to do a more thorough testing and optimization.
LET’S BE CAREFUL OUT THERE
If the market is in a down-trend, you should tighten your stop-loss compared to your stop levels in an uptrend. Working with two different stop levels is not difficult because you always know the conditions under which you bought a position. Besides the tighter stop-loss levels in a downtrend, you should also consider using a slightly smaller amount of your total capital for each trade. If you enter any position in an uptrend with, for example, 4% of your total capital, only 2% to 3% should be used in a downtrend.
With these simple money management rules, you minimize your risk significantly but are still allowed a reward when the market is making its corrections.
Denmark-based Peter Konner has a BSc in computer science. He works as a business analyst within the insurance business and manages a private mutual fund for a number of investors. He has been using technical analysis for more than 26 years and is focused on long-term wave analysis and trading systems.