Trading Articles
Cloudbanks By Thomas N. Bulkowski

Want to double your money? Invest in cloudbank chart patterns and you just might. During the 30 years I have spent investing in or trading the markets, I have discovered many chart patterns, including pipes, horns, and barrs. Here’s another, which I call the cloudbank pattern. Investing in cloud-banks gives you the opportunity to make a lot of money if you are patient and price rises back into the clouds.
IDENTIFICATION GUIDELINES
Figure 1 shows an idealized example of a cloudbank chart pattern. It begins with price moving horizontally for several years, but the duration can vary from pattern to pattern. The shortest length in my study was five months and the longest was almost 17 years, with the average duration being 2.75 years. The cloudbank is nothing more than a ceiling of overhead resistance.
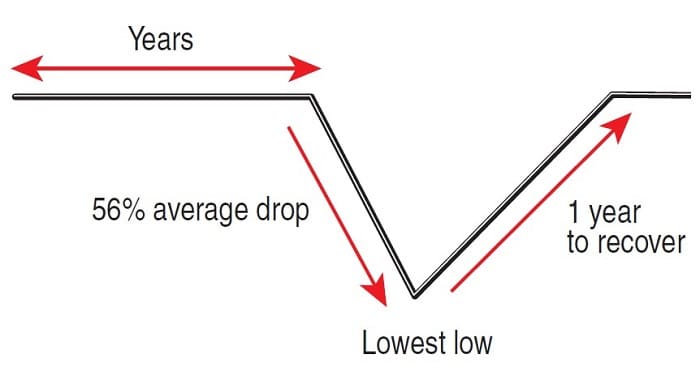
The bottom of the cloudbank should have a horizontal base, but often it’s irregularly shaped. By “irregularly,” I mean it is uneven with several valleys approaching the same price separated by large distances. Sometimes, price pokes through the base, but that’s fine. Ignore cloud tops because they aren’t important. After the cloudbank comes a swift decline to the lowest low that averages 56% for those patterns in which price returned to the cloud-bank. Following a V-shaped bottom, price rises, and it takes about a year to return to the cloudbank.
EXAMPLES
Often, a bear market causes the drop out of the clouds, but not always. Let’s look at some examples to watch the pattern take shape. Figure 2, on the monthly scale, shows a cloudbank pattern that is also a symmetrical triangle. The bottom of the cloudbank is at 4.50 and the lowest low (point A) is 1.50, giving an investor plenty of opportunity to at least double his or her money when price returns to the clouds. The market (the Standard & Poor’s 500) in 1994 moved lower at the start of the year and then horizontally, but the stock (Savient Pharmaceuticals [SVNT]) took a big hit.
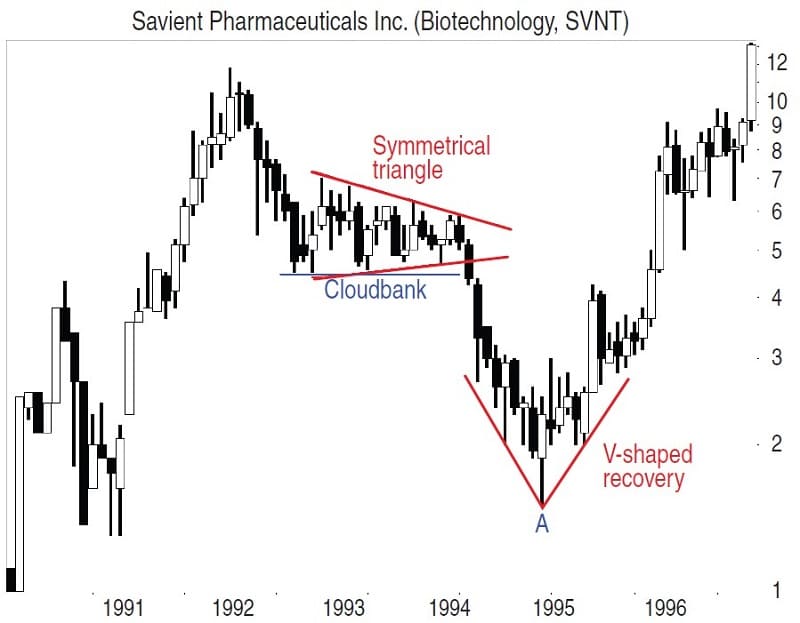
Figure 3 shows Freeport-McMoRan Copper and Gold (FCX) with a cloudbank pattern that begins in 1996 and runs to the autumn of 1997. Price drops out of the clouds like a skydiver having problems with his parachute. From 28, price falls until it bounces off the pavement at 6.75 in November 2001, almost a year ahead of the general market (which bottomed during a bear market in October 2002).
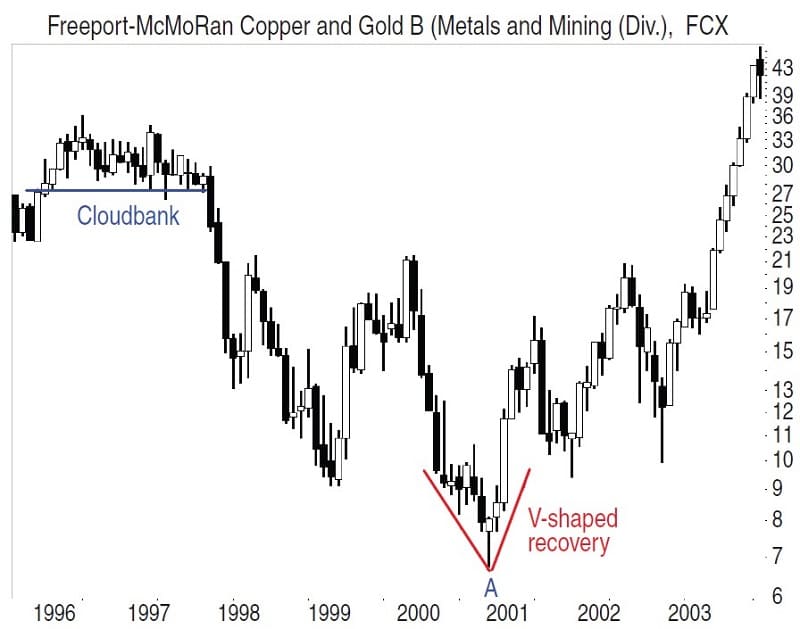
Higher lows and higher highs mark the flight back into the clouds for our intrepid skydiver. Price returns to 28 less than three years after the lowest low. Note that Figures 2 and 3 have V-shaped bottoms around the lowest low. Figure 4 shows another cloudbank pattern with price moving horizontally for at least eight years before running into trouble in 1998. Price makes a swift decline from just below 3 to a low at A of 1.16. Having price drop below the base of the cloudbank isn’t as important as the distance between the base of the cloud and the lowest low (point A). Look for large drops so you can ride the recovery.
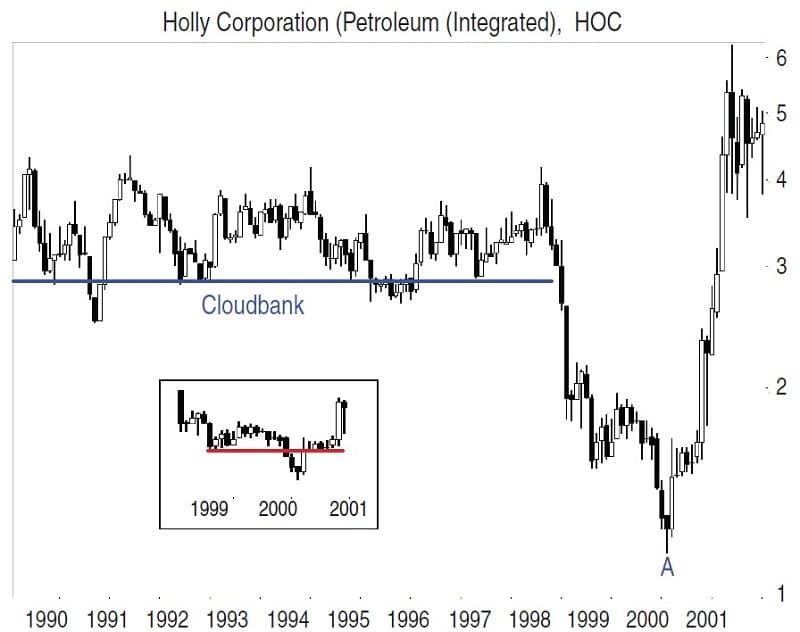
Note how the stock (Holly Corp. [HOC]) begins its recovery (May 2000) just after the bear market in the S&P 500 begins (March 2000). In addition, see how the shape of the turn surrounding the lowest low is V-shaped at the very bottom but looks like a saucer pan with a dent in it, shown in the inset (monthly scale, too).
Figure 5 shows one of my favorite cloudbank patterns, a stock that I own. The cloudbank began in August 2000 and lasted to October 2007 before the 2007–09 bear market saw price plunge from the cloud base at 55 to a low of 2.56. If the stock (XL Capital [XL]) returns to the cloudbank, the gain is going to be tasty for those investors that bought near the low (at A). I started buying the stock just above $4 in October 2008, bought more in April 2009 at $6.52 to $7.93, and at least doubled my money (so far) in all trades.
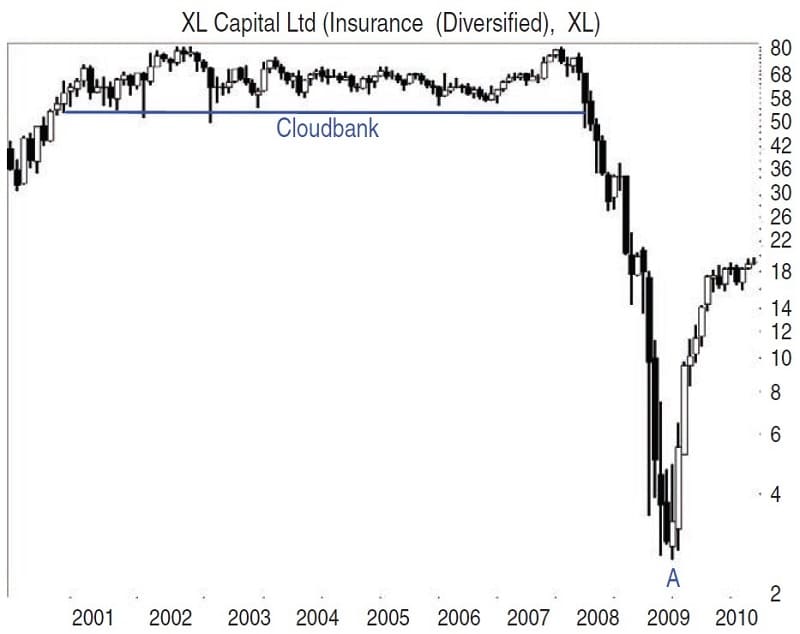
Figure 5 highlights what I like to see in a cloudbank. That is: 1) A defined cloudbank of overhead resistance that lasts for years; 2) a sharp plunge that takes the stock lower; and 3) a decline significant enough to be worth investing in the stock even after a late entry. The theory behind the cloudbank is that the stock’s normal price, established over years, represents where the stock should be selling. If a bear market takes it down, when the market recovers, so too should the stock. It should regress back to the mean — rise back into the clouds. That’s the thinking I used to find, research, and trade these patterns. Now, let’s talk about performance.
THE NUMBERS
What is important about the cloudbank pattern is that price returns to the clouds. How often does that happen? To answer that, I found 184 cloudbanks in 574 stocks from January 1990 to February 2010. Unfortunately, many of the cloudbanks are too recent to have returned to the clouds, but 59% did so. Using a cutoff in 2005 for the end of the cloudbank (which is the date before the stock makes a large drop), 90% of those cloudbanks had price return to the base of the cloud. If you are willing to wait, you have a 90% chance of having a successful investment (if history repeats itself).
Suggested Books and Courses About Chart Patterns


How much time must you wait for the stock to recover? It depends on how severe the decline is. Small declines take less time than do larger ones. The 2000–02 bear market was not as severe as the 2007–09 bear market. For those stocks returning into the clouds, the average recovery time to make the trip was 1.1 years with an average decline of 56%. For those stocks still waiting for recovery back to the cloudbank, the drop was an average 81%, and as of the end of this study, they have been trying to recover for 1.4 years. The drop for cloudbanks before January 2007 averaged 59%, but those occurring after that date dropped an average of 73%.
A frequency distribution of the times shows that 34% of the stocks take six months to recover, another 34% take a year, and 14% take 1.5 years. That’s to the base of the cloudbank. When you compare the transit time from the lowest low (point A in each figure) to the base of the cloud with the time to climb to the top of the cloud, the two times are comparable. It takes as long to reach the cloud as it does to move though the cloud (1.1 years versus 1.0 years, respectively).
TRADING
Now that we know cloudbanks make for a good investment, how do you buy one? When I buy a cloudbank pattern, I am not looking for a double or triple but a home run. That means the recovery potential from the lowest low to the base of the cloud has to be large. Since the average decline is 56%, I ignore drops of less than 50%. Once the stock has dropped at least 50% from the base of the cloudbank, I use a 30-week simple moving average (SMA) applied to the weekly chart. Buy when price rises above the moving average. What you don’t want to do is buy a stock that continues falling. That’s why a 30-week simple moving average comes in handy. I prefer the SMA over an exponential moving average (EMA) because the SMA tends to hug price better at the turns.
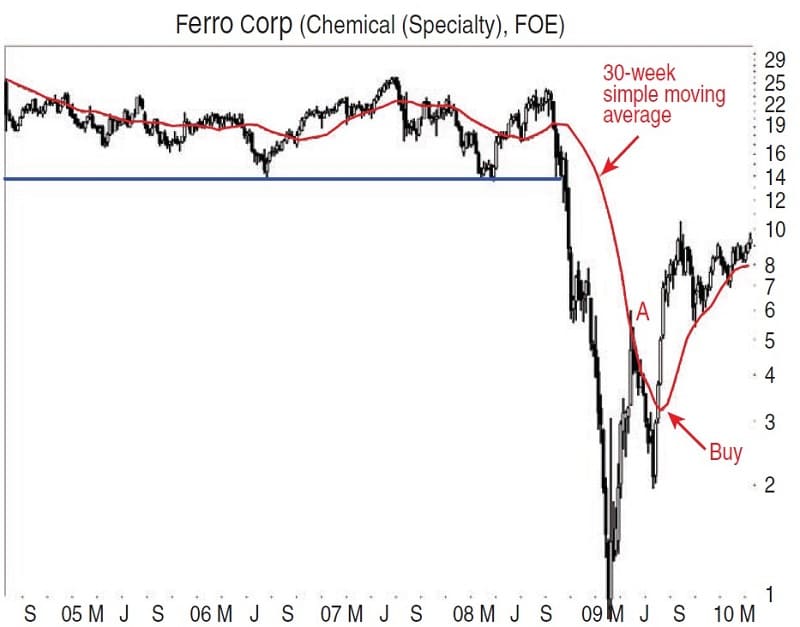
Figure 6 shows a portion of a cloudbank going back to 1991 with a base just below 14 (full disclosure: I also own this stock). Once the stock (Ferro Corp. [FOE]) drops below 7 (a 50% drop), then I would be interested. Applying a 30-week SMA to the chart (black line) shows that price poked above the moving average at A. If you bought at the high on that date, you would have purchased the stock at 6 with a potential profit of at least 13.50, or 125%. However, the plunge from 6 to 2 might have caused medical problems.
If you waited for price to close above the moving average before buying at the open the following week, you would have an entry price of 3.80, for a potential gain of 255%. You can use other techniques to buy into the stock. Divergence between the stock and an indicator like the relative strength index (RSI) or commodity channel index (CCI), ugly double bottoms (that’s a double bottom with the second bottom higher than the first), and other indicators can signal an entry. Try not to buy before the stock reaches the lowest low, and the 30-week SMA can help with that. Then hold your breath as the stock climbs.
The rise comes in many shapes, but often the bottom where the lowest low resides is V-shaped. Thus, when you get a buy signal, don’t be afraid to jump in and hang on, because the ride could be bumpy. When price hits the base of the cloud, sell. You can take a chance and see if price will rise to the top of the cloudbank, but that only happens 42% of the time (so far), and the rise is half what it averages on the way up to the cloud.
CLOSING POSITION
The cloudbank pattern represents a ceiling of overhead resistance, but also a profit opportunity when price drops. Wait for price to bottom at the lowest low and then buy in. Hold the stock, probably for years, until it reaches the base of the cloudbank. Then sell and look for other cloudbank investments. At the links shown under “Suggested reading,” I offer two pages that discuss cloudbanks. One reviews the pattern, while the other shows a trading setup based on the cloudbank pattern.
Thomas Bulkowski is a private investor with 30 years of experience and is considered to be a leading expert on chart patterns. He is the author of several books, the most recent of which is Encyclopedia Of Candlestick Charts. His website and blog have more than 500 pages of free information dedicated to price pattern research and can be found at www.ThePatternSite.com.