Trading Articles
Candlestick Analysis in Commodities and Futures: A Structured Approach
Commodities and futures: the optimal use of leverage. Incorporating Candlestick signals into commodities and futures trading is of vital importance. Knowing when and where the shift occurs in bullish and bearish sentiment for leveraged investment vehicles is essential for successful trading. To foresee the potential change in price direction produces outstanding trading profits. This is not pie-in-the-sky rhetoric. The Candlestick methodology was developed for the purpose of exploiting profits from commodities trading. Four hundred years of proven results came about through trading rice. Putting the signals to use in fast-reacting markets is not new for Candlestick analysis. It is probably safe to say that Candlestick analysis is the oldest technical trading method in the history of investment markets. Its use has delivered unrivaled results for the Japanese rice trading houses for centuries. It is the ideal method for increasing profits on its own merits or for being overlaid onto existing successful trading programs. The combination of Candlestick reversal signals is the perfect complement to existing proven trading programs. Overlaying the two methods can be a useful filtering process for reducing and/or eliminating bad trades.
On its own, Candlestick trading delivers impressive results. Keep in mind, investor sentiment is built into the signals. The appearance of a signal is the result of change of sentiment. This furnishes instant data required by a trader to make decisions. Whereas other technical programs provide indicators that a change of direction might be occurring, the signals tell you that the turn is occurring, giving the trader the advantage of a head start.
The information conveyed by the creation of the signal informs the Candlestick analyst that the trend sentiment has been altered. That realization also acts as excellent stop-loss calculations. Note that in Figure 13.1, representing August Feeder Cattle, the Doji was the signal that illustrated that the uptrend had come to a top. Stochastics confirmed the peak. The lower open the following day gave clear indication that the bears were taking control. Where should the stop-loss be placed?
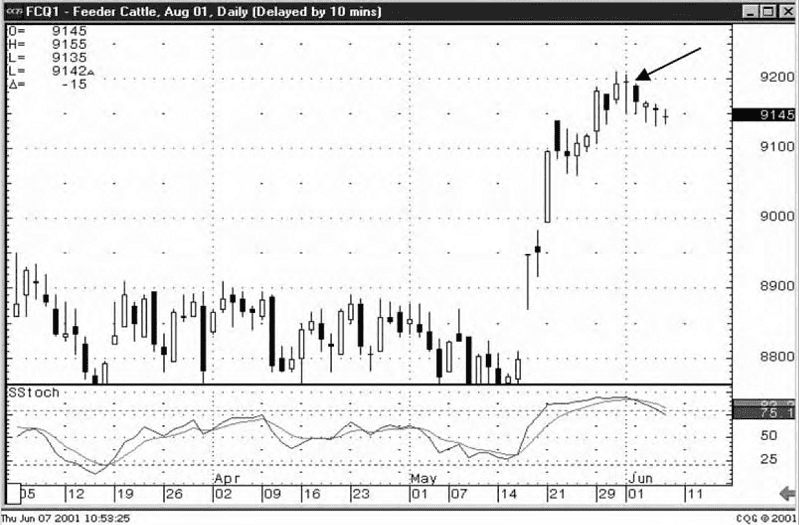
Going back to basic logic, it can be easily surmised that if the Doji represents indecision at the top and a lower open the next day demonstrates that the selling has started, that would be the optimal point to short Feeder Cattle. All indications lead to prices going lower. Using the same line of logic, if the Doji were the sell signal, confirmed by the lower open the next day, prices had hit their high point in this rally. That rationale can be built into a logical stop-loss level. The high trading level on the day of the Doji was 92.05. A stop-loss can be set one level above the 92.05 at 92.10. If the Doji were the topping signal, it would be logical to say that if prices went above the top of the topping signal, then the top was not indicated by the Doji. Get out of the trade.
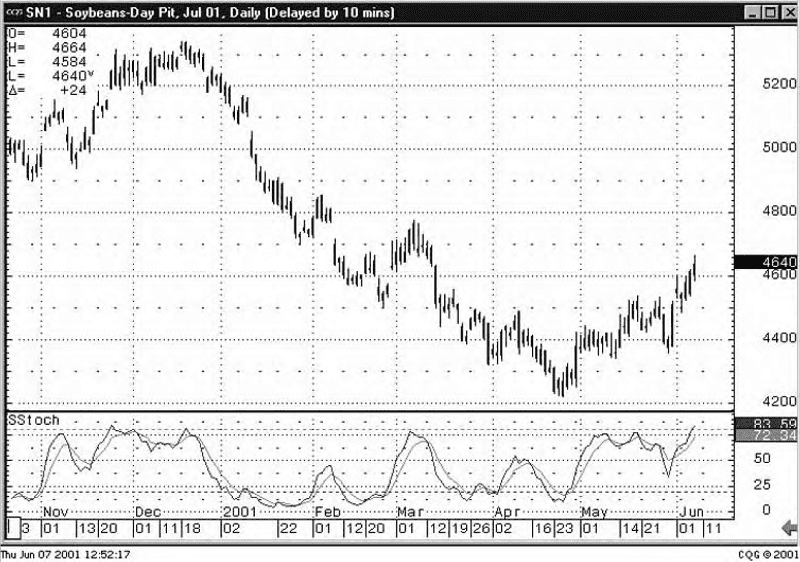
Most commodities and futures positioning, like equity investing, is based upon fundamental reasons. The word positioning is the functional word of this statement. Day-trading and short-term trading lean more toward technical analysis. Fundamental analysis for individual commodities and futures is subject to fewer outside factors that influence the movement of price. Agricultural products are greatly influenced by the weather. The projection of crop reports or feedlot numbers, price movements of related commodities, and acres planted are all factors for evaluating fundamental elements. Fortunately, with a small number of factors to evaluate, research is accomplished with fewer variables to affect a trend. This enhances the value of a trading method that accurately identifies a trend. You have to contend with less waffling or fluctuation. As seen in the Soybean chart in Figure 13.2, the trend persists for weeks on end, thus providing a long-term holding period that generates tremendous profits. Profits can be further enhanced with position management, increasing or decreasing the total position as the short-term Candlestick signals dictate.
Commodity traders or futures traders who are oriented toward fundamental research for the basis of their trades can find valuable attributes in Candlestick analysis. Fundamental research diagnoses what the correct direction should be by evaluating how all the known information should affect the price movement. Putting a trade on should be the conviction of that analysis. However, not all researchers have all the pertinent information available to them.
Advanced Books and Courses on Candlestick Patterns
Having Candlestick charts that show direction or signals that contradicts the researchers’ analysis can act as a monitoring system. The Candlestick charts, showing a sell signal when all fundamental information warrants a buy, reveals that something may be wrong. If selling is coming into the price, there may be fundamental factors that haven’t been researched yet or existing information was not evaluated correctly. This information inconsistency should prohibit a major positioning mistake. The other possibility is that the fundamental research prognosis is correct, but it may not be factored into the price by the rest of the market participants as of now. The timing may be too early.
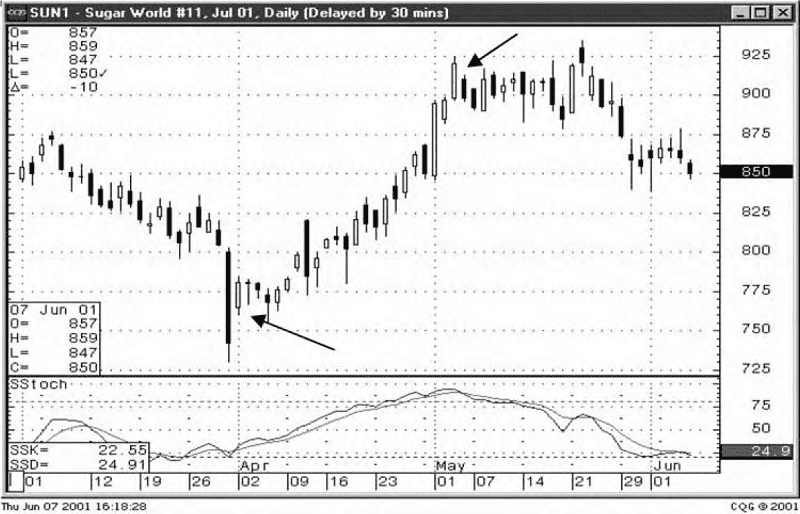
Whether trading grains, meats, currencies, or metals, the signals will be apparent in whatever trading entities have fear and greed involved. Note that in Figure 13.3, representing World Sugar, Haramis start the trend and end the trend. You need to adhere to trading rules more stringently when dealing in the commodities and futures market. A wrong move against a highly leveraged position can devastate equity quickly. Applying the basic rules and common sense analysis of the Candlestick signals puts the favorable probabilities on your side of the ledger.
Being able to view any chart has invaluable benefits for a full analytical investment program. Where is the NASDAQ going tomorrow? Where is the Dow going tomorrow? Knowing how surrounding factors and markets have an effect on particular trading entities helps you perform fast and interpretive analyses to draw conclusions on the entity that you are trading. As seen in the 30-year bond chart in Figure 13.4, a bearish Engulfing Pattern has just occurred. Stochastics indicate that they are turning down.
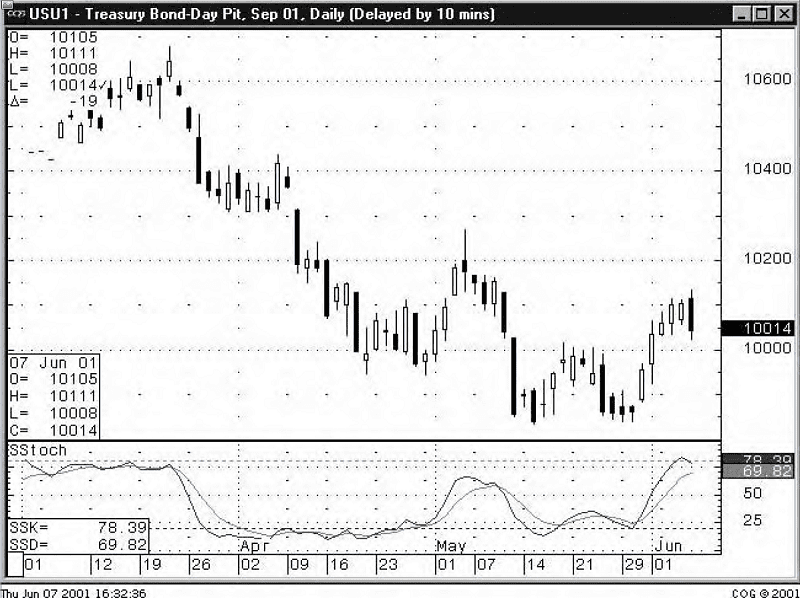
the bond market will move adds insight on how the stock indexes will move.
At quick glance, bonds should be selling off. If that information is added to the analysis of what affects what you are trading, it benefits you in having another piece of information that helps confirm the signal you are about to trade or thinking about continuing the hold of an existing trade. For example, if it has been verified by past occurrences that the bond market going down, that is a good indication that money is flowing out of bonds and into equities, and it adds validity to a bullish trend on the NASDAQ or Dow chart if the bond market can be seen as turning down. Having the ability to see Candlestick formations provides another tool to quickly analyze an associated trading entity. Each factor that you line up to verify a trade is that much more information to put the probabilities in your favor.
Use the Candlestick signals for commodities and futures trading. Do not disregard the elementary rules for protecting capital. Using the Candlestick signals as a framework puts the odds of profitable trades greatly in your favor. Don’t let the lack of verbage in this chapter act as an indicative barometer as to the importance of candles to trading commodities and futures. On the contrary, the signals act as a much purer indicator for entities that have fewer market considerations. An important adjunct for fundamental investors is the accuracy and ease with which the Candlestick formations illustrate when fundamental perceptions are not being embodied in the price. When all fundamental evaluation leads to crude prices going up, but the Candlestick signals show prices going down, you need to make a quick and thorough review.
Apparently there is a fundamental influence being projected into the price that you or your research has not taken into account. Fortunes can be made in the futures market. Candlesticks are the closest technical tools to perfect short-term trading programs. Keep in mind, it was commodity trading that developed this method. Its credibility has already been proven. Using it properly is the bridge to success.