Trading Articles
Quantifying Candlestick Patterns for Statistical Analysis
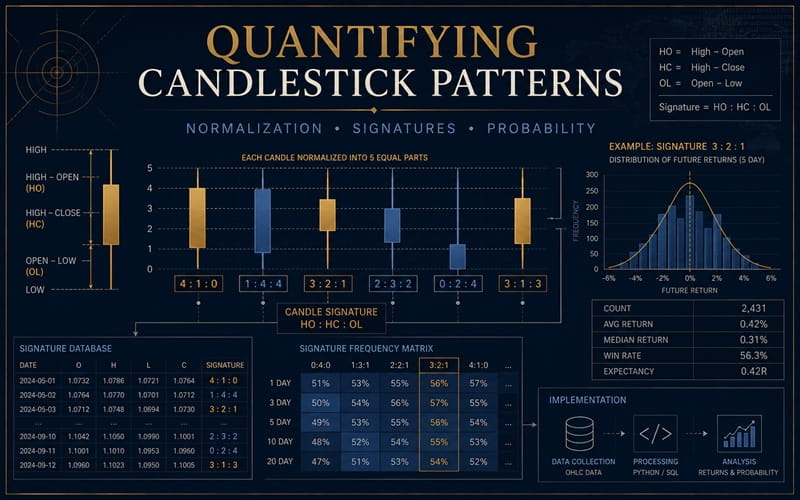
They’re the life of the party—simple, elegant, and add so much value. Here’s how you can turn each candle bar into a set of three numbers so you can identify patterns and determine the strength of their predictive power.
Compressing Them
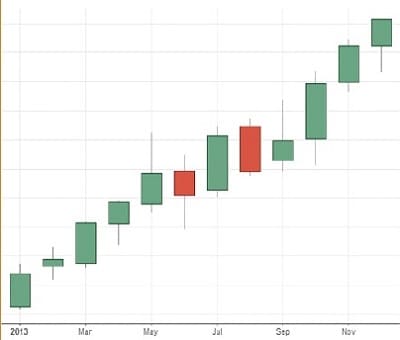
Candlesticks are the epitome of information packaging. A candlestick can represent price action—the hem & haw of buyers vs. sellers for a minute, a day, or a year. They tell which party won in the end, which parties began their fight in the beginning, how high the buyers pressed the sellers, how low the sellers drove the buyers (Figure 1). Candles are a simple, elegant device yet they convey so much information.
The variation of candle wick heights and bodies makes it challenging to use them as a tool to consistently tell you what the market is doing. In this article, I’ll present a means to simplify candlesticks in a way that allows a trader to identify patterns and perform consistent searches using these patterns. The trick is to turn every candle into a set of three numbers as follows:
- HO: High minus open
- HC: High minus close
- OL: Open minus low
- Thus: HO:HC:OL
But in order to perform this compression, you must first measure the average range over a prior moment in time. I’m going to use the moving average range (just the range, not the average true range) as the gauge for measuring every candlestick. Let’s get started.
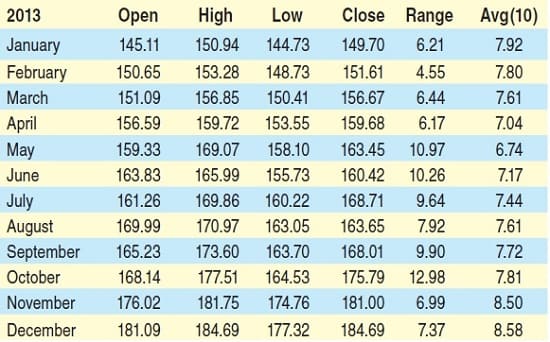
If you use monthly candles, as shown in the table in Figure 2, as a basis for measurement, you’ll use the prior 10 months as the input for the average range. This number is some-what arbitrary, but any number from five to 20 would be adequate. I calculated the first 10 months’ range averages using months dating back into 2012 (not shown).What follows is an Excel-compatible equation to calculate the HO, HC, and OL values from the monthly bar OHLC values. An explanation follows the calculations.
Calculation:
- Segment count = Number of slices into which the average range candle will be cut
- Segment divisor = 100/segment count
- Average range = N-period moving average of range
- Candle range = High – low
- Range multiplier = Candle range/average range
- Candle range = Candle range / 100
- Range multiplier = Range multiplier > 1, 1, range multiplier
- O = Round(((( high – open) / Candle range ) * Range multiplier) / Segment divisor)
- HC = Round(((( high – close) / Candle range ) * Range multiplier) / Segment divisor)
- OL = Round(((( open – low) / Candle range ) * Range multiplier) / Segment divisor)
- Candle signature = HO-HC-OL
You can get a probability of future returns and bet on that probability.
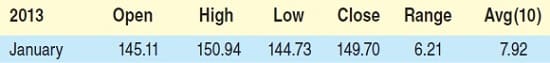
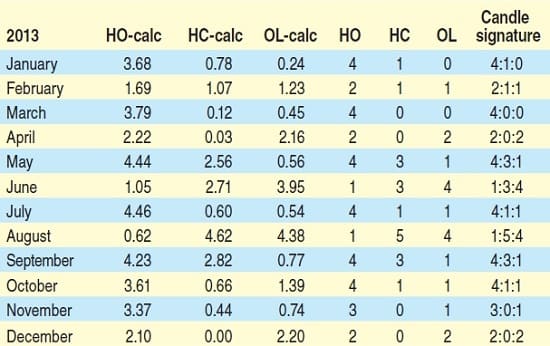
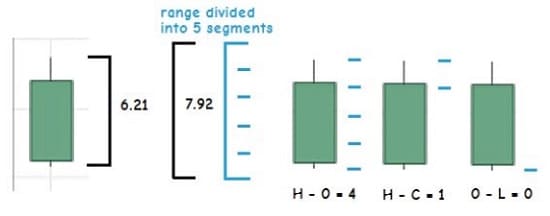
In Figure 3 you see an example using January 2013 as the input.
- Segment count = 5
- Segment divisor = 100 / 5 = 20
- Average range = 7.92
- Candle range = 150.94 – 144.73 = 6.21
- Range multiplier = 6.21 / 7.92 = 0.78
- Candle range = 6.21 / 100 = .0621
- Range multiplier = 0.78 (If greater than 1, use 1)
- HO = Round(((( 150.94 – 145.11) / .0621 ) * 0.78) / 20.0) = 4
- HC = Round(((( 150.94 – 149.70) / .0621 ) * 0.78) / 20.0) = 1
- OL = Round(((( 145.11 – 144.73) / .0621 ) * 0.78) / 20.0) = 0
The candle signature for January 2013, once the numbers are rounded, is 4:1:0. In Figure 4 are the 2013 monthly candlestick signatures calculated using the calculations described. When devising this candlestick compression scheme, my intent was to find a way to force every market data bar into a specific format. Comparing each candle to its previous brothers gives you a relative ratio and insight as to the trading behavior within this period of time. Then using this average range as a baseline, you segment this range into a fixed number of equal value parts. These become the increments by which every candle’s parts are then measured. Once each candle part has been normalized into this range, the parts measurements are fixed at whole numbers of the segments.
Segment count determines how gross or fine the candle patterns are defined. A small number, say, three, will compress candles into a very narrow range of values. This limits the overall number of patterns any candle can assume: 0:0:0 to 3:3:3, which equates to 4 x 4 x 4, or 64 possible candle patterns. A larger number, say, nine, would provide for a much greater granularity of candle definition but would explode the number of patterns discovered: 0:0:0 to 9:9:9 or 10 x 10 x 10, which would equal 1,000 different candle patterns (theoretically).
Advanced Books and Courses on Candlestick Patterns

During testing, I’ve found that three to six candle segments is optimal. By reexamining January’s candle pattern, 4:1:0, I can now derive where these numbers came from (Figure 5). The equation that I divined after considerable experimentation simply allows each candle to be compared and measured by the range segments as a sort of dynamic ruler. Of course, the true calculations give you decimal values like 3.68 for high-open, but rounding into whole numbers allows you to capture the general candle dimensions, which reflect the underlying trading behavior.
Candlesticktistics
So why go through all this trouble to create a condensed version of candlesticks? One word: probability. Now that I have a convenient means of classifying candles into a fixed number of patterns, I can perform statistical analysis of these patterns to see if they contain a predictive capability. I do this by dynamically capturing candle patterns as I process a security’s time series and then measure into the future if price went up, down, or stayed flat and by how much, after a specific number of following periods.
For instance, returning to the monthly candles but instead of just using 12 months’ worth, I’ll use all the monthly data for the SPDR S&P 500 ETF (SPY) since 1993. I’ll measure the month-over-month returns out one, two, three, and four months grouped by candlestick pattern (the top 10 in count). The table in Figure 6 depicts this.
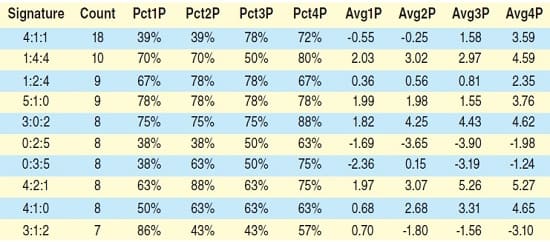
- The 1Ps are one month later, 2Ps are two months later, and so on
- The PctXPs are the percentages of times that the following month(s) closed greater than the pattern month
- The AvgXPs are the average returns (in price units) of the difference between the following month(s) and the pattern month.
I uploaded all the month data into a simple database and performed a simple SQL query to group, sum, and calculate by candle pattern.
What can we deduce from these numbers? First off, statistically, there is not enough data to build a significant outlook. If I peer into this small data set and examine the pattern 1:4:4, the number of instances (which is 10) is just not enough to base a prediction on. But imagine if I had 100 instances of 1:4:4. That might persuade me to use this data in a probabilistic manner. What would happen if at every close of the month in the future I dust off my candlestick compression algorithm, measure the month candle, and discover that the month that just closed presented the 1:4:4 candle pattern? You can see that I have a 70% chance of the next month closing higher and the fourth month from now closing higher at an 80% probability. This is why I would want to use this condensed candlestick method. You can get a probability of future returns and bet on that probability.
Complex Patterns
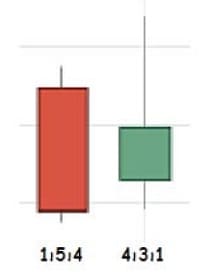
So far I’ve demonstrated a fairly simple candle pattern categorization technique. Using this method I can compress and classify any time series set of OHLC bars. I could measure the candles for the entire S&P 500 daily, hourly, or minute data set. But using a single candle is not really going to give me, in the long run, a predictive analytic. However, I can combine candle patterns. What would happen if I combine the candles for August and September into a single pattern? Would the pattern 1:5:4-4:3:1 produce a more deterministic probability output (Figure 7)?
What about three candle patterns in a row? This will obviously reduce the number of patterns per combination. Maybe you can reduce the resolution of the individual candle patterns. If you lower the segment count from five to perhaps four or even three, you could create three and four candle patterns such that when you search the entire stock universe of daily or hourly data, you could easily collect thousands of instances.
Applying The Strategy
The candle pattern equation is simple to code into an indicator or strategy for your trading platform of choice. Producing a database of candle patterns is also an easy task. I created a vast Excel file and imported it into a simple database. But to help you right out of the box with your own candle pattern discovery, I’ve created a Python-language trading strategy (Python Code For Condensed Candlesticks). The code is also available on www.Quantopian. com for you to clone and try out. You can find the strategy under the “candle patterns” heading and you’re free to test and explore this candlestick analysis technique.
Free Your Mind
There are numerous ways you can use candle patterns to assist in creating a probability-based trading tool to help you pick those opportunities with a high win rate. Exploring candle patterns in combination with other technical indicators may help you pinpoint accurate conditions. A 1:2:3 pattern in concert with a rising 50-period moving average might predictably produce winners 60% of the time. Knowing such statistics can go a long way toward freeing your mind of the worry of trade performance.