Trading Articles
Gann Angles Explained: Geometry, Time, and Price Alignment

Earlier I mentioned that trend was defined by a pattern of higher bottoms and higher tops for an up trend, and a pattern of lower lows, and lower highs for the downtrend. This is true even on the most minute tape reading scale since horizontal support and resistance levels tells us where the buyers and sellers are. Angles are a form of straight line moving averages which estimate momentum and normally an angle suggests where buyers or sellers should be, based on a charts price movement momentum. Note, however, that angles per se do not show actual support and resistance like the patterns on a bar chart, and therefore must be used only as an estimate to be verified with trading bars occurring at the same level.
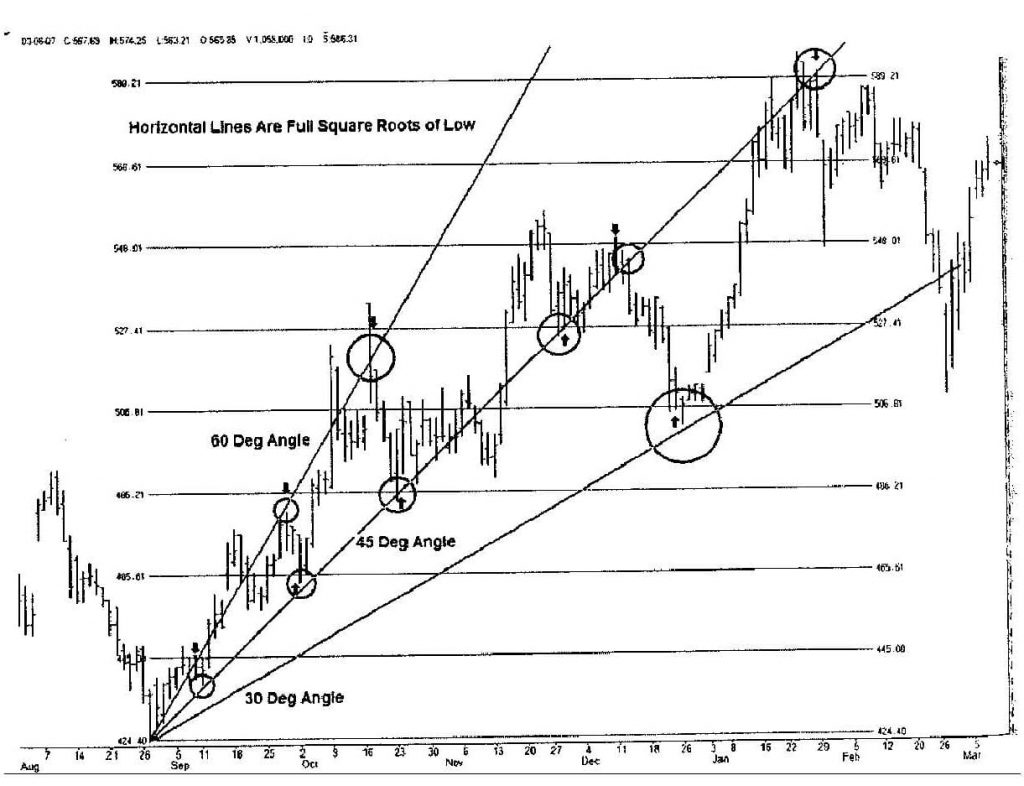
The above chart of CME shows traditional angles of 30, 45, and 60 degrees. Also shown are horizontal lines that are full square root increments up from the low. The ‘circled’ areas are where the projected resistance or support based on angle momentum should be found and it does work. Note especially, however, the small ‘arrows’ on the chart which point to the square root levels that are most near the expected angle targets. Since the angles are approximate targets we must look to find some kind of real support or resistance to sell against or buy on.
Advanced Books and Courses on W.D. Gann Methods


When the calculated targets combine with the projected angles targets, you will get a reversal. Keep in mind two things. The first is that you need a reversal signal bar to know the trend has changed, so you just don’t buy or sell on the angle per se, but you could use a very tight stop at that point. The second observation is that as a professional trader you must buy or sell at precise targets and not just any haphazard target that pops up. If you have an angle nearby, you should sell at the calculated target (those arrows above) or wait for your tight stop to be hit. Also note the principle that when one angle breaks the price must go to the next angle down.
This chart shows my ‘offset’ method made popular in my earlier books and often gives much better trendline fits if you are trading off the angle itself as a target. The angles are ‘offset’ from the prior movements axis to incorporate the totality of the overall pattern. The longer and more powerful the prior advance or decline from which the angles are offset, the better they work. In this method it is to be noted that the long term trend is almost always broken when the powerful 90 degree offset angle is broken. The price almost always bounces off the 90 degree angle the first time it is hit, for another major leg. These are best used on longer term charts to see the swings but I use them every day on time frames as small as one minute.
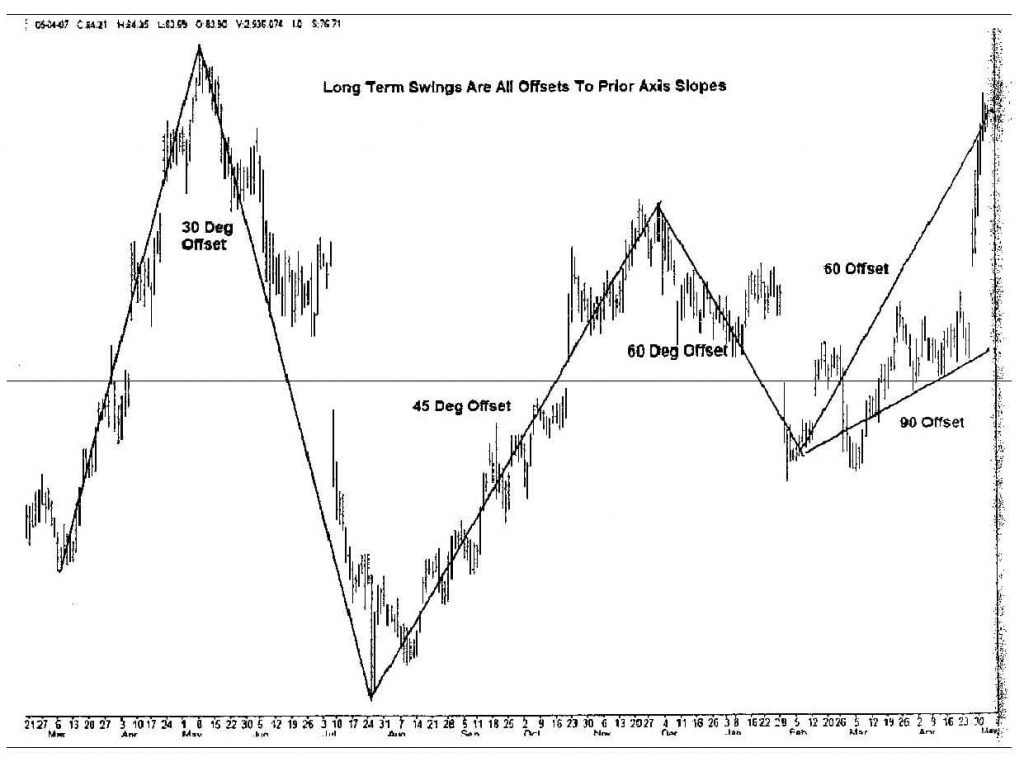
Here’s a longer term chart of 3M Company showing how every major swing was a near perfect offset angle to the next leg. These types of angles can serve as projection forecasts because the price pattern often terminates on the angle at a major support or resistance target. The above charts use traditional angles of 30, 45, 60, and 90 degrees as opposed to the very popular ‘Gann’ angles or ‘geometric’ angles. These angles also work but I prefer the traditional. The geometric angles come from dividing time and price ‘boxes’ into proportionate parts. The next chart shows the method. The ‘key’ is to get the correct size of the ‘box’. I do that by drawing a circle around the 1st low to high and in this way I get a radius vector in any direction, which is superior to a straight up and down measurement of the low to high advance. After the circle is drawn I box it in and then subdivide the box sides.
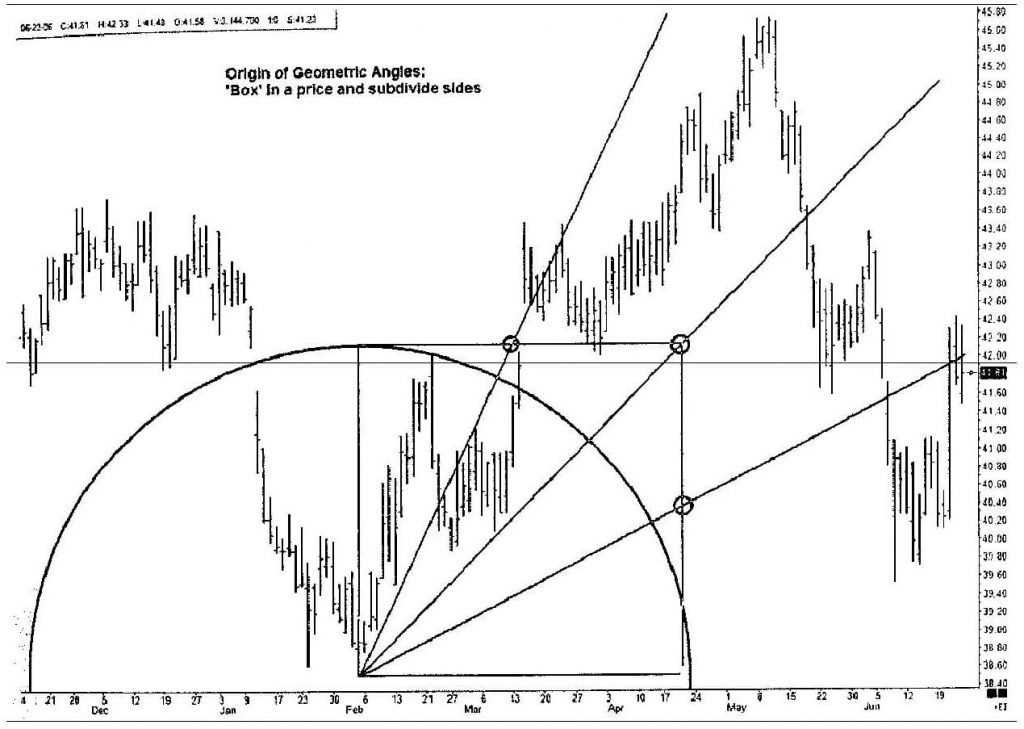
These angles are labeled 2×1, 1×1, 1×2, and in some cases you can use 1×4 and 1×8 subdivisions. The ‘2×1’ tag is just your plotting coordinates of ‘over 2, up 1’, or ‘over 1, up 2’. In this chart we see a rough correlation with price support and resistance but nothing great to trade off of. Unfortunately most software packages just draw these angles in a straight up and down axis, so you may have to make your own as I usually do. The following chart shows the vastly superior results when you orientate the axis of the ‘box’ to the price impulse axis of the chart. Then the angles can be used for trading purposes. Also note that the intersection of the angles within the box, and to the circle, create both horizontal support and resistance levels, and vertically, time cycle turns. If your software package allows you to move your ‘Speed Resistance Lines’ or ‘Gann Fan’, or ‘Gann Square’, then you should always line them up to the proper axis of the Charts direction and not straight up as they default to.
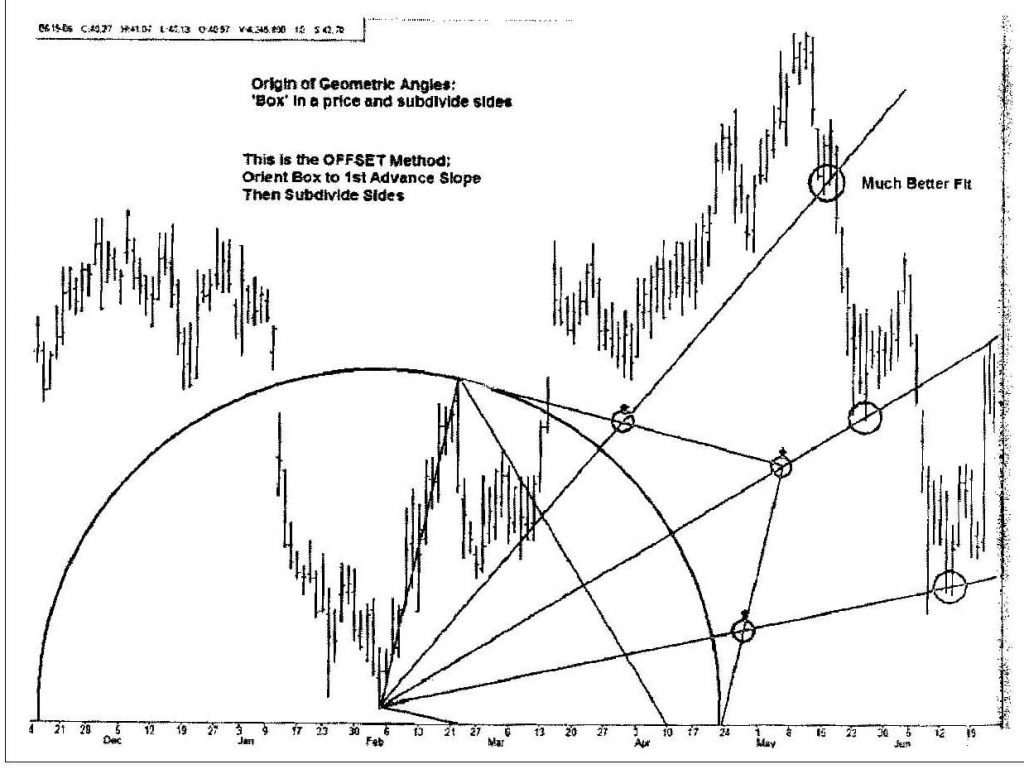
On this chart above also note the small ‘arrows’ at the intersection points. Straight up above arc the market turns. The chart on the following page is that of a 5-minute S&P chart showing how the method works on any intra-day time frame and also advancing the concept to include the idea of ‘stacked’ boxes and more subdivisions of the box sides. If you took this to an extreme you would see just about all of the fluctuations on this chart accounted for with the various angles and intersecting time and price points.
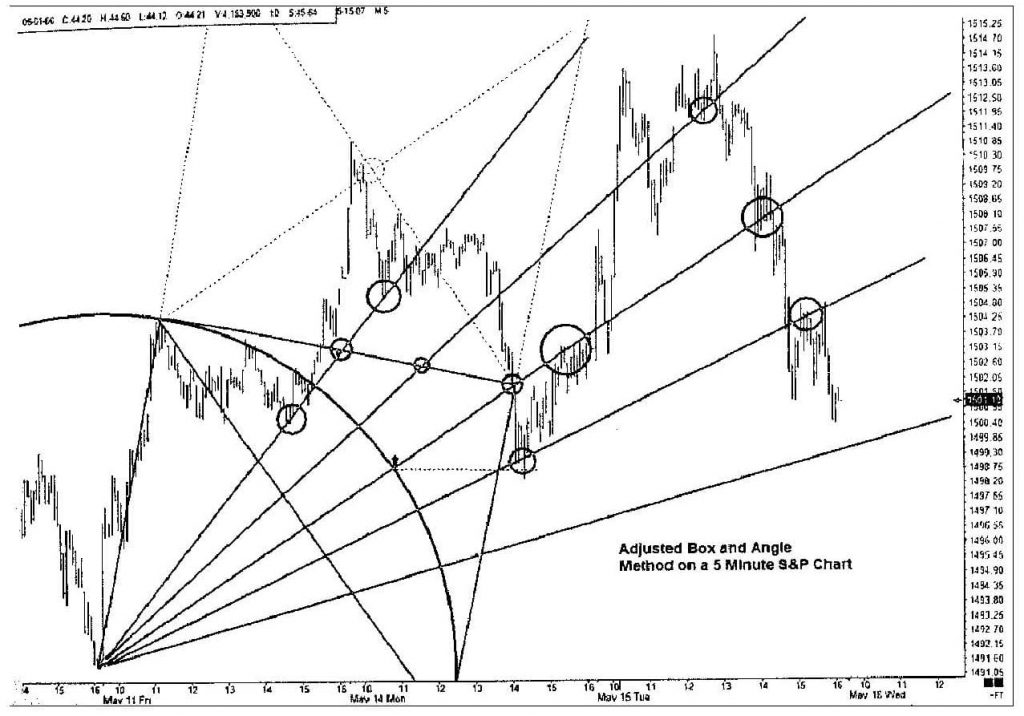
One note in particular is of interest above. The 2×1 angle that subdivides the ½ point of the top of the box continues up to the top of a second ‘dotted’ box placed on top of the first. Note that the end point of this trendline is at the same price level as the final high for the S&P. Since this angle is the hypotenuse of two stacked boxes, its length is the square root of 5 (A^2+B^2=C^2). See how if you use that length as the radius of a circle and swung it down it would describe the subsequent down leg perfectly and time the bottom as it reached horizontal.
As a side note, I might add that I usually don’t have the time to program all kinds of angles and circles on my charts and I simply rely on inexpensive plastic triangles I buy at any office supply store. These are 30, 60, 90 triangles, and 45, 45, 90 triangles. I simply hold them over my charts and draw the lines with my trendline tool on the software. It really only takes 15 seconds or so once you get the hang of it. Most of the exhibits in this book, especially the ‘offset’ angles are constructed that way.