Trading Articles
A Simple Positive Expectancy Strategy By Azeez Mustapha

Do you want your trading results to improve? Incorporating positive expectancy into your trading strategy may just be the ticket. Capitalizing on effective supply & demand zones is one way traders can play the markets victoriously. Incorporating positive expectancy into a trading strategy that capitalizes on supply & demand zones adds even more value. In this article I’ll explain a simple and effective way of doing this.
The Speculation Method
When price breaches a demand zone to the downside, that demand zone becomes a supply zone. The new supply zone will be an area of resistance to any future rallies since downward movement is now favored. When price breaches a supply zone to the upside, that supply zone becomes a demand zone. The new demand zone would try to resist any ensuing pullback since it favors upward movement.
Pinpointing supply & demand zones would help you notice the price areas where the bulls & bears may push prices up or down. The more challenge a demand or supply zone gives a price (as is seen when the price retests it), the more significant the bias will be when the zone is breached to the upside or downside.
This simple but effective trading method considers supply & demand zones together with a simple moving average (SMA). The method can be used on a 30-minute time horizon and is good for currency and commodity markets; it is good in trending markets. Playing the markets can create trading opportunities when accumulation and distribution territories come into play. This would be even more agreeable in a market that is free from unfair manipulation.
Entry Criteria
Go short when the price breaks a demand zone to the down-side and closes below it, provided that the SMA is sloping downward, confirming a downward bias. Make sure that the price is below the 30-period SMA when you go short. Go long when the price breaks a supply zone to the upside and closes above it, provided that the SMA (30) is sloping upward, confirming an upward bias. Price should be above the SMA (30) when you go long. I’ll discuss the details of the strategies later. When the SMA (30) is flat or fails to confirm a bias convincingly, no trades would be considered.
The higher time horizon has more significant supply & demand zones. These zones can be drawn automatically or manually. See the sidebar “Plotting Supply & Demand Zones In MetaTrader” for instructions on how to plot supply & demand zones manually.
Transitory drawdowns will still exist for various reasons. Price will still move in a direction you didn’t anticipate, which is why it is necessary to gain control of what you have. It is crucial to control everything you can control on your account. The more trades you make, the less weight an individual trade has on the overall fate of your account.
PLOTTING SUPPLY & DEMAND ZONES IN METATRADER 4
Supply & demand zones are also known as support & resistance levels (accumulation and distribution levels). These price zones/levels can be plotted automatically using a custom indicator available in MetaTrader 4. Alternatively, the zones/levels can be plotted manually. To do this in MetaTrader 4, click on insert, then click lines, and then click on horizontal lines. You can then place the mouse on the chart, moving it up and down to draw the line. This process can be repeated as many times as you feel necessary.
For the trading method described in this article, effective supply & demand zones are commonly plotted at certain round numbers, usually with 50 or 00 as the last two digits. For example, if the NZDJPY was trading at 86.46, the demand zones below it would be 86.00, 85.50, 85.00, etc. The supply zones above it would be 86.50, 87.00, 87.50, etc. Likewise, if the GBPUSD was trading at 1.6758, the immediate demand zones would be 1.6750, 1.6700, 1.6650, etc. Immediate supply zones above it would be 1.6800, 1.6850, and 1.6900.
Details Of The Strategy
- Strategy name: Positive expectancy trader
- Strategy type: Discretionary
- Suitability: Suitable for full-time traders
- Time frame: 30-minute chart
- Indicators: SMA (30); supply & demand zones
- Short trade: Go short when the price breaks a demand zone to the downside and closes below it, provided that the SMA is sloping downward, confirming a downward bias
- Long trade: Go long when the price breaks a supply zone to the upside and closes above it, provided that the SMA (30) is sloping upward, confirming an upward bias
- Stop: 60
- Target: 120 pips
- Risk–reward ratio: 1:2
- Position sizing: Use 0.01 lots for each $1,000 (and thus making it 0.1 lots for $10,000); or 0.1 lots for each 10,000 cents in a cent account (making it 1.0 lot for each 100,000 cents)
- Risk per trade: 1%
- Breakeven stop: You can adjust your stop to breakeven after you have gained up to 40 pips
- Trailing stop: You may set a trailing stop of about 50% after you have gained up to 100 pips (Note: the use of trailing stop is optional)
You need to know how every market condition would affect the performance of your trading method.
Suggested Books and Courses About Trading With Indicators


Speculating Examples
In each chart, the red vertical line on the left shows where a position was opened while the red vertical line on the right shows where it was smoothed. The period separators depict where one trading day ends and where another one begins. On the chart, the SMA (30) is in blue. Spreads were not reflected in these speculation examples.
Example A: On May 28, 2014, the GBPJPY challenged the demand zone at 171.00. The price closed below that demand zone, and when another candle was formed, a short trade was opened, which ended in a profit. In Figure 1, you can see that the trade was taken mainly because the SMA (30) was sloping downward and the price action that warranted the signal happened below the SMA (30).
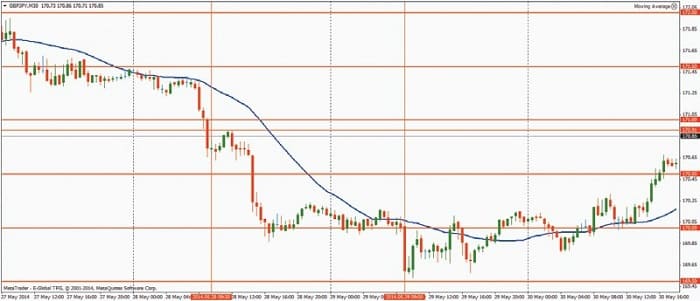
- Instrument: GBPJPY Order: Sell
- Entry date: May 28, 2014
- Entry price: 170.75
- Stop-loss: 171.35
- Take profit: 169.55
- Exit date: May 29, 2014
- Status: Closed
- Profit/loss: 120 pips
Example B: On May 20, 2014, the GBPAUD, which was already strong, breached the supply zone at 1.8050 to the upside and closed above it. The SMA (30) was already sloping upward, confirming the uptrend. A long trade was opened on the formation of another candle. The trade hit the target on the same day. In Figure 2, note that the price was above the SMA (30) and the breach of that demand zone also took place above it.
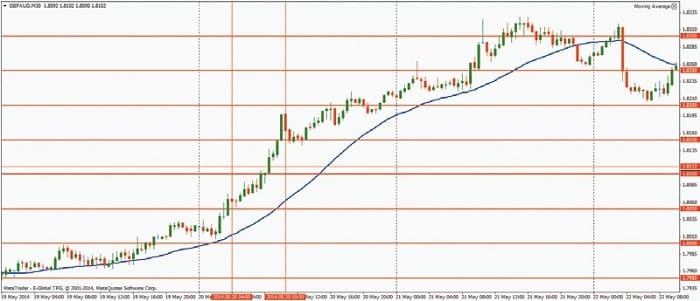
- Instrument: GBPAUD
- Order: Buy
- Entry date: May 20, 2014
- Entry price: 1.8067
- Stop-loss: 1.8007
- Take profit: 1.8187
- Exit date: May 20, 2014
- Status: Closed
- Profit/loss: 120 pips
Example C: In the example in Figure 3, the trailing stop (which is optional) was used. The purpose of this risk-management tool is to remove the risk on your trade as well as lock in some of the profits you have made. However, the downside is that this may result in a premature exit. Nevertheless, the trade in this example was a success. On May 20, 2014, the EURAUD moved further upward (it was already in an uptrend), breaking the supply zone at 1.4700 and closing above it. A trade was opened when the next candle formed.
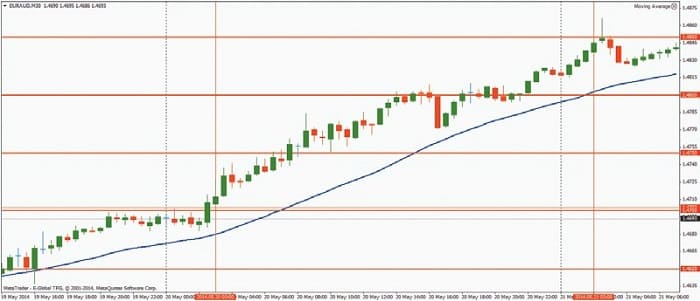
- Instrument: EURAUD
- Order: Buy
- Entry date: May 20, 2014
- Entry price: 1.4720
- Stop loss: 1.4660
- Take profit: 1.4840
- Trailing stop: 1.4770
- Exit date: May 21, 2014
- Status: Closed
- Profit/loss: 120 pips
You need to know how every market condition would affect the performance of your trading method. For example, the bulls would be forced to give up their previous gains when price becomes bearish. Buy & hold participants will get shaken out of the market. The bulls & bears will have their patience tested when price enters an equilibrium phase. When you combine two speculation methods, the profit made by the first one could be affected by the drawdowns experienced by the other. The only way to be victorious in the markets is to embrace negativity because that is what will end up bringing profits.
A Helpful Approach
This trading method is effective; just ignore all long signals when the SMA (30) is sloping downward and disregard signals to go short when the SMA (30) is sloping upward. This puts the odds in your favor and gives you a better trading experience when you go through the zigs and zags of the markets. A positive expectancy method, like the one explained in this article, would keep you profitable in the long run. You will always experience positive and negative periods but controlling negativity and optimizing positivity will keep you in the game and result in an impressive equity curve.
Azeez Mustapha is a trading professional, an InstaForex official analyst, a blogger at ADVFN.com, and a freelance author for trading magazines. He is working as a trading signals provider at some websites.