Trading Articles
Principles of Market Forecasting: Time, Price, and Cyclical Structure
“By the Law of Periodical Repetition, everything which has happened once must happen again and again and again-and not capriciously, but at regular periods, and each thing in its own period, not another’s, and each obeying its own law…the same Nature which delights in periodical repetition in the skies is the Nature which orders the affairs of the earth. Let us not underrate the value of that hint.”—Mark Twain
There are multiple techniques used in technical analysis to anticipate and/or forecast possible future movements of the markets. Some techniques such as the Elliott Wave are based on a type of pattern recognition. Other forms of technical analysis pattern recognition include the classic chart formations such as the “head & shoulders”, “double tops & bottoms”, “triangles”, “cup & handle”, “Bull & Bear Flags”, “Japanese Candle Sticks” to name a few.
Other techniques rely on the measurement of market volume and/or open interest either individually or in combination with market patterns. Then there is the use of technical indicators such as moving averages, relative strength, stochastics, momentum, etc., which are used to form opinions about the current condition of the market and thus anticipate some kind of future direction. Of all the techniques available, it is the use and knowledge of time cycles that allows one to project and/or model the future!
This is possible because price action seems to unfold in repetitive rhythms over time. W.D Gann used his knowledge of time cycles to make many incredibly accurate market forecasts in his day. Gann believed that “Time is the most important factor in determining market movements” because everything moves in cycles, as the result of the natural law of action and reaction. “By a study of the past, I have discovered what cycles repeat in the future”.
Gann was not the only person in his day to use cycles to amass significant wealth. The extremely rich Rothchild family along with individuals like J.P. Morgan also used cycles to manage their investment decisions as well. In 1875 Samuel Benner wrote a small book called “Benner’s Prophecies of Future Ups and Downs in Prices”. Benner’s Pig Iron price forecast, which came true over a 60-year period, produced a gain to loss ratio of 45 to 1. Benner also created a forecast chart of financial panics that was titled “Periods in Which to Make Money”, which was probably made during the Civil War. In this chart, Benner forecasted a high in business activity and thus a high for our financial markets for the year 1972 followed by a panic type low for 1981, a very good call. The actual low came in 1982, but a good call never the less.
Benner then called for a business activity top in 1989 as he was anticipating a major recession between 1994-1996, which was another very good call as 1994 certainly experienced a recession. He expected 1996 to be a great buying opportunity with his next panic due in the year 1999. Considering that this forecast was made in the 1800’s, and the actual panic started only one year later in 2000, I feel that this was yet another great call.
I bet there are plenty of people that wished they sold their stock portfolios in 1999! In 1944, Edward R. Dewey, President of the Foundation for the Study of Cycles produced a ten-year Stock Market forecast based on a synthesis of 10 different cycles that produced a gain to loss ratio of 185 to 1. The forecast and corresponding chart can be found in his book “Cycles, The Mysterious Forces That Trigger Events”.
Advanced Books and Courses on Market Cycles & Timings
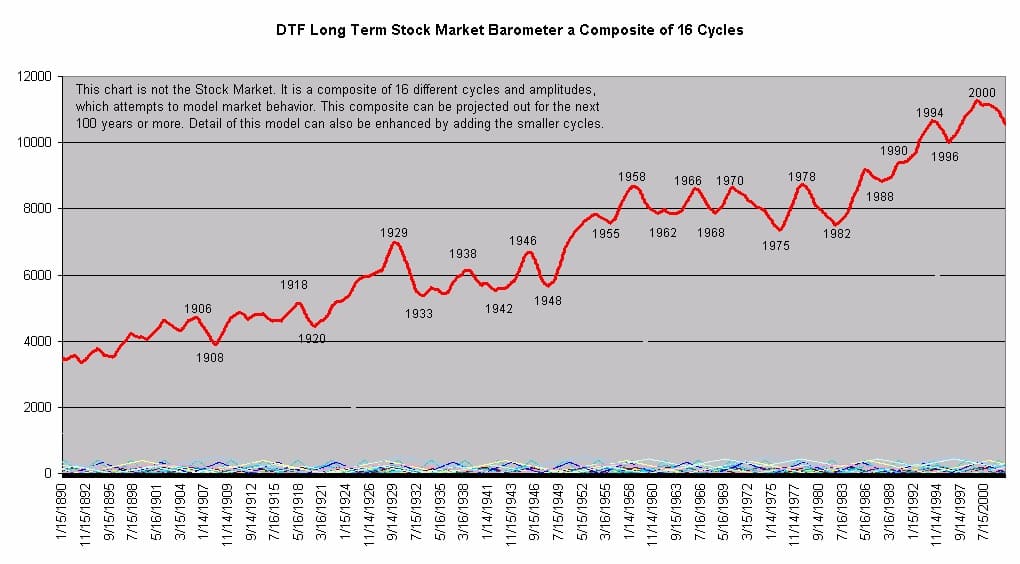
W.D. Gann claimed “that it was just as easy to forecast the upcoming year as it was to forecast the next 100-years based on his cycle theory”. After years of research, I can certainly understand his opinion. Along with this article, I’m including a chart I created that attempts to model the markets movements over the last 112-years using only the summation of 16 different cycles and amplitudes. Overall, this chart has been a very good model of the Stock Market and it can easily be projected out for the next 100 years just as Gann claimed.
“The Future is just a repetition of the Past”. I’m currently finishing a book on market cycles, which will include the 100-year projection based on these same 16 cycles. All of my personal Excel worksheets and Stock market data will be included with the material so that you can duplicate the basic process for other markets.The material will cover both long term forecasting and more intermediate term forecasting using cyclic models.