Trading Articles
Vibrations in Price Swings: Time, Rhythm, and Market Cycles
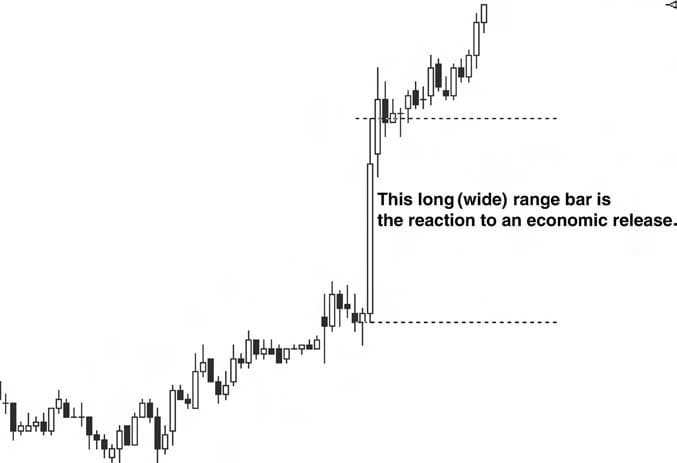
Vibrations in the markets can be thought of as sound waves. The louder the sound, the farther it will travel. Eventually the sound will lose momentum as it travels, and the momentum will dissipate. The same analogy could be used describing an object being dropped. The larger the object and the greater the distance it is dropped, the larger the vibration that is created as it meets with a surface. Price movement is very similar to this. As an example, a release of an economic report or news-related item could cause prices to suddenly thrust up or down. Figure 3.4 shows an example of a price thrust or expansion after the release of an economic report. Shocks such as natural disasters, currency devaluations, and wars are extreme events that will have larger vibration effects on the markets.

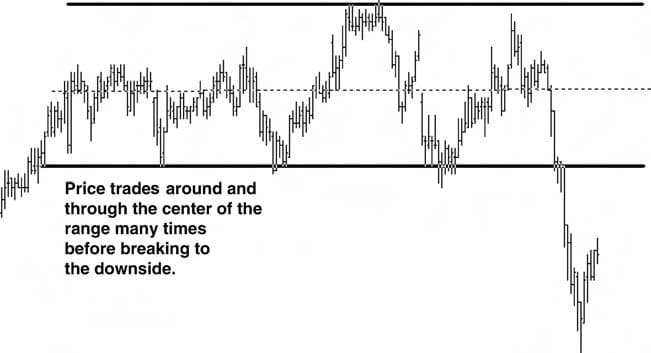
When prices have stayed within a range for a while, it is a matter of time before they move away from that range. Many times prices will move away from the range with urgency in the form of a trend. Figure 3.5 is an example of a range that formed, and when price broke to the downside out of the range, it did so in a decisive manner that was evident in the long (wide) range bars.
Using the price behavior from Figure 3.5 as an example, the price contracted as it formed the range and expanded as it broke the low price support area; it then began trending. What we can say is that strong vibrations can equal a trend, while milder to weaker vibrations will form a range. The trading range can also be thought of as stored energy. Eventually this energy will have to be released in one direction or another. The milder and weaker vibrations usually will not have enough strength to sustain a trend.
Advanced Books and Courses on Market Cycles & Timings
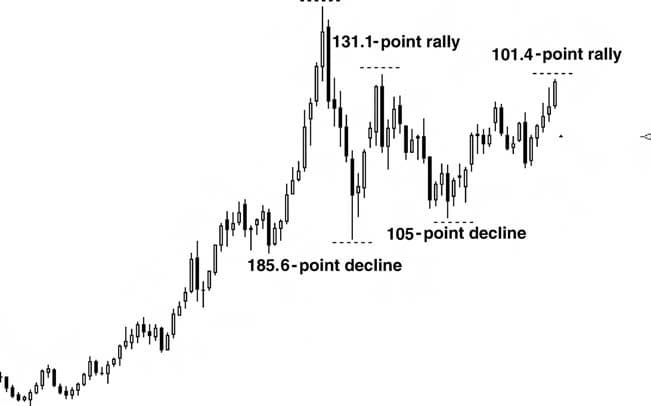
It is possible to see increased volatility that creates strong vibrations or price swings. The market will trade in both directions as market participants battle back and forth until a winner is decided. Once the winner has taken control (either bulls or bears), the price can have very strong vibratory movements (such as a trend move) in one direction as the losing side liquidates positions and new participants in the direction of the trend pile in. Figure 3.6 shows dramatic swings in the gold futures weekly chart as bulls and bears battle over the direction. Considering that each 1-point move in gold equals $100 per contract, these moves are significant.
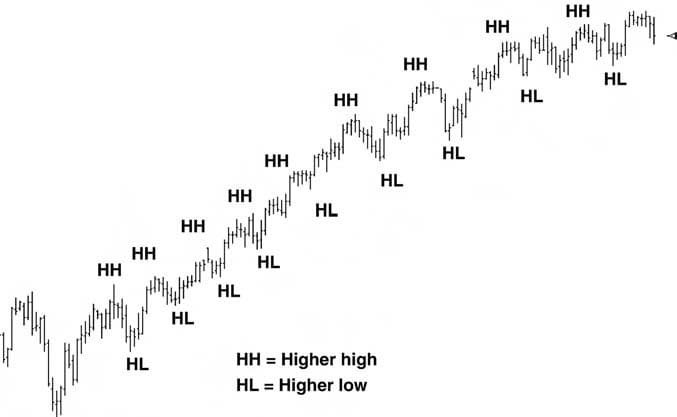
Market participants will attach varying degrees of emotional meaning to the price as it moves up and down. As an example, if one side, such as bulls, participates in large numbers on the long side of the market (aggressive buying), that would create a stronger uptrend move or vibration in price (Figure 3.3). The opposite would be true for a strong downtrend move (Figure 3.2).