Trading Articles
Median Line Theory: Structure, Geometry, and Market Application
Introduction to Median Line:
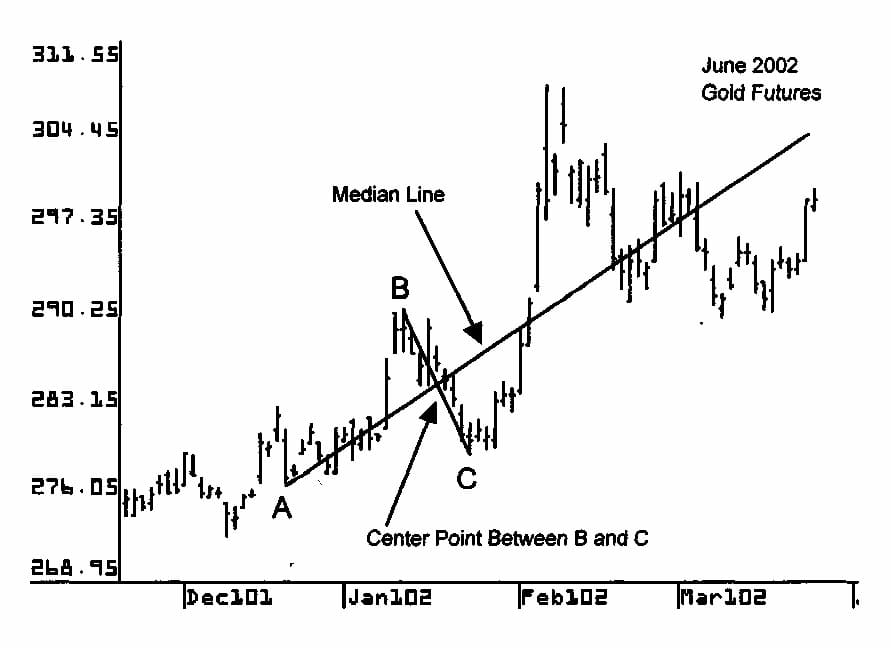
The trendline for which Andrews is best known is the Median Line. The chart on this page shows an upward sloping Median Line. Three pivots are needed to draw a Median Line. Two of the pivots must be the high and low of a price swing. The mid-point between these first two points must be calculated. This is calculated through simple division and addition. The range between the high and low is divided by two and added to the low value. The same is done for the amount of time between the high and low. On the chart below, the middle point between pivots В and С is used to draw the Median Line. Next, a third pivot which occurs before the price swing described in the paragraph above is selected. Usually this is the pivot immediately before the price swing described in the paragraph above but can be any pivot. This third pivot is the Median Line starting point. On the chart below, pivot A is the starting point for the Median Line. The Median Line is drawn by connecting the starting pivot A and the middle of the В – С price swing. Note that the line between pivot В and С is not required to draw this Median Line. This line has been added to help the reader easily see the pivots used to draw the Median Line.
Median Line Theory:
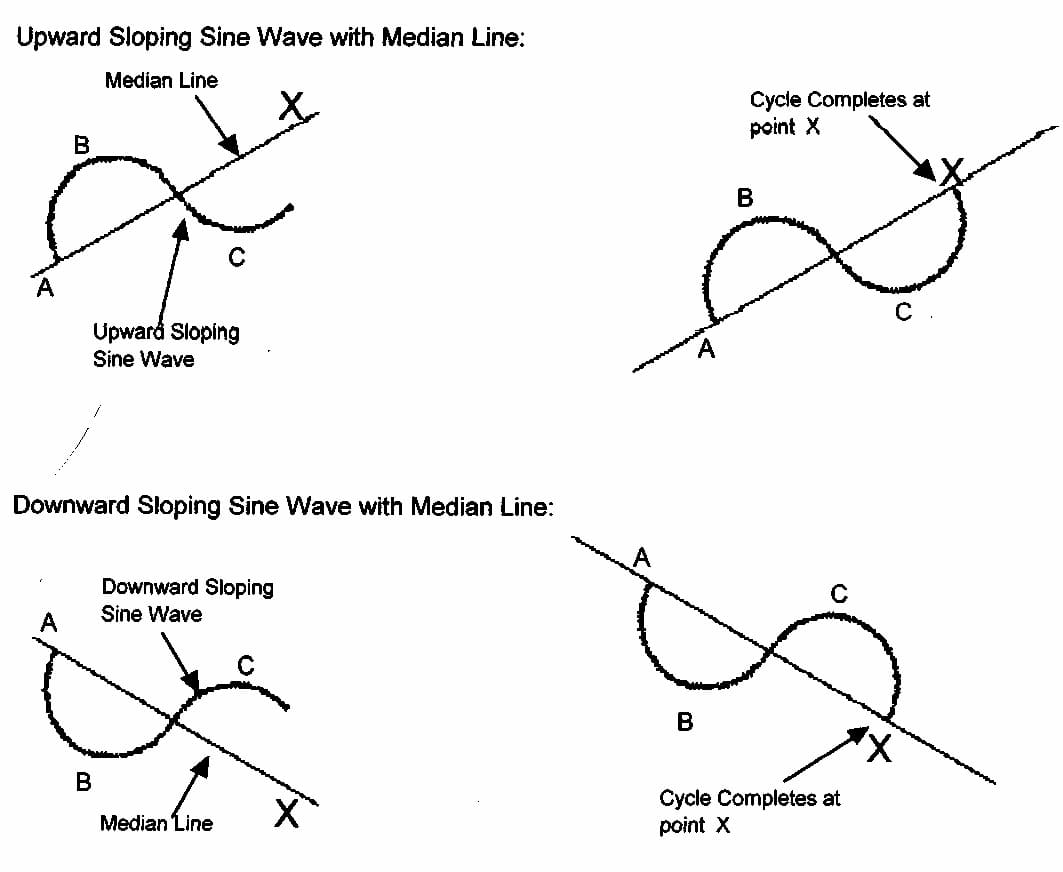
Andrews always held that the Median Line is based on the laws of physics. He believed that principles from physics could be applied to financial markets. The diagrams below show the principle on which the Median Line is based. These principles are that natural cycles return to their centers, and for every action there is a reaction. The top and bottom diagrams on the left show a sine wave cycle which is only partially complete.
Advanced Books and Courses on Technical Analysis


In these diagrams, A is the starting pivot and the Median Line is drawn through the center of В and C. In the second two diagrams on the right, the sine wave moves back to the Median Line at point X. At point X, the sine wave completes one cycle. When a swing in the financial market returns to the Median Line, it also complete one cycle. Andrews believed that the price returns to the Median Line about 80% of the time.
Median Line Trading Principles:
Andrews made several observations about the Median Line which are important for traders. These are not absolute rules; they are general observations made by Andrews which will help a trader know what to expect when using the Median Line.
- Median Line Trading Principle 1: When a Median Line is drawn from the most recent swings the price should return to the Median Line approximately 80 percent of the time.
- Median Line Trading Principle 2: When the price returns to the Median Line there often will be a pivot made on the Median Line.
Median Line Trading Principle 3: When the price returns to the Median Line the price often will form several small swings around the Median Line and touch the Median Line more than once before moving on.