Trading Articles
Trade Exit Strategies: 10 Selling Methods
Do you spend as much time deciding to sell as deciding to buy? Here are 10 tips to make deciding when to sell easier. The stock of Ferro Corporation (FOE) has flatlined like a dead animal since November 2013. It is now 2015, and I have more than doubled my money. Should I sell? Every trader or investor must answer that type of question for their own investments. In this article, I’ll discuss 10 selling tips to help you find your answer.
Tip #1: Use stops
This has to top the list of selling techniques because it makes the process simple. If you use a stop-loss order, you can quit worrying about when to sell. The order will take care of that. All you have to do is locate the stop in the right place. Stop placement is an art beyond this article, but if you are having difficulty, use a volatility stop.
I learned about volatility stops from Perry Kaufman’s book A Short Course In Technical Trading. The idea behind a volatility stop is to place a stop far enough away from the current price to avoid being stopped out on normal price movement. A volatility stop works well when no other stop locations are nearby.
To use a volatility stop, compute the high-low difference of price each day for the last month (about 21 price bars). Average the result and multiply by 2 to get the volatility. Subtract the volatility from the current low price to get the stop price. Trail the stop upward as price rises. This type of stop is similar to a chandelier stop, but Kaufman’s stop performs better. I found that a multiplier of 2 works best for my trades, but you may prefer 1.5 or another number. If the stop price, in percentage terms, is too far away from the current price, then skip the trade and find a less volatile stock.
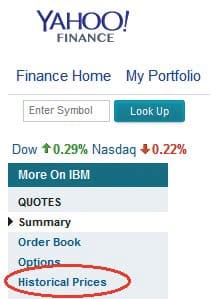
The computation need not be a painful experience. One way to do it is to go to http://finance. yahoo.com (Figure 1), type in the stock symbol, and on the left, you’ll see a link to historical prices. I show that circled in red in Figure 1. Click on that link and download the prices into a spreadsheet. On the same Yahoo page, the link for a spreadsheet download is located below the price grid. Subtract the high price from the low and use the average() worksheet function to get the volatility. I am providing a sample spreadsheet at Here: VolStop.xls that does this math for you. All you have to do is paste in a month’s worth of price quotes from Yahoo.
Tip #2: Sell at a target price.
When the stock reaches a price target, sell. You should have the target (and a stop-loss) price picked out before trading the stock. Consider placing the target just below overhead resistance, such as at a prior peak or valley, or at a round number (double or triple zeros such as $9.00 or $10.00 are good for daytraders), or at some other price target. If using a round number, consider sell-ing a few cents below the target, like 8.93 and 9.95. You want to beat the crowd to the exit.
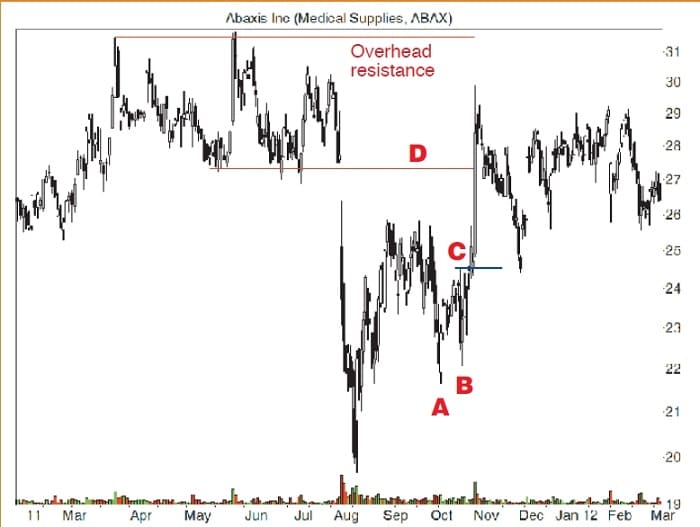
If you are using chart patterns as the entry signal, take the height of the chart pattern and add it to the breakout price to get a target. That method works about 70% to 80% of the time, depending on the chart pattern. You can cut the height in half for a closer target that will work close to 90% of the time. In Figure 2 you see such an example.
A double-bottom chart pattern appears at AB and it confirms as a valid pattern when price closes above C, which is the highest peak between the two bottoms. C is also the breakout price. The height from C ($24.50) to the lower of the two bottoms, A ($21.67), is 2.83. Add the height to the breakout price (C) to get a target of $27.33. Line D shows the target. For double bottoms, this method works 68% of the time. Using half the height boosts the success rate to 86%. Line D is also where overhead resistance begins (between the two red lines). Thus, the target and overhead resistance merge to form a good sell target.
Target selling is most useful for swing and daytraders because time is money (that is, they want to keep their money in stocks climbing the fastest). Position traders looking for a trend change (a drop of at least 20%) should avoid using this approach. That’s because, as the chart shows, selling at the price of line D limits profit since the stock can continue higher.
Tip #3: Sell after an adverse breakout.
If you see a chart pattern and buy into it before the breakout, sometimes the breakout is opposite of what you had planned. In that case, sell immediately. This applies to any approach you use to buy a stock. If the stock moves in a surprising direction (down when you expected it to rise), then you need to sell your position. This tip is especially useful during earnings season. A stock suffering a hit in earnings will get slammed by the market. For any trading style other than buy & hold, sell immediately. Otherwise, the stock is likely to be whacked
again in three or six months’ time.
Advanced Books and Courses on Risk Management and Position Sizing


Tip #4: Watch for countertrend moves.
Last year I was planning to add a stock to my portfolio, but when I checked its price, I saw that the stock price was dropping when the Dow Jones Industrial Average was soaring. That drop in the stock was a countertrend move. You may have heard the phrase a rising tide lifts all boats, but this boat had a hole in it. I avoided the stock and saved myself from drowning.
I did a study on stocks that made countertrend moves. I compared stocks that dropped when the index made a significant move upward (at least 1%). Stocks that dropped underperformed the index for at least three months and underperformed the trend followers (those stocks that followed the index higher) for a year. You can find a link to this research in the “further reading” section at the end of this article.
Avoid buying or owning countertrend stocks by checking whether they drop when the market makes a big move higher. If so, and if they do that for several days in a month, consider selling those holdings. The days need not be consecutive, but if the countertrend moves occur too frequently, you will be able to do better by selecting a stock that follows the uptrend.
If you wake up in the early hours of the night and your first thought is of trading, that’s a clue you have unresolved issues.
Tip #5: Obey indicator sell signals.
If you are a system trader, when your system issues a sell order, obey it. If you try to finesse the exit by waiting, that could cause you more grief because you’re creating a bad habit. Imagine that you delay selling and the stock climbs further. By holding on longer, you are rewarded. The next time this scenario unfolds, you do the same thing and make more money. By delaying selling and winning, you create a bad habit that is like a bomb waiting to explode. Eventually, the same scenario will unfold, you’ll hold on, and boom! The stock will plummet, giving you a huge loss.
If your system is flawed such that it gives sell signals too early, then that’s fine. Indicator testing can identify this problem. I’m not talking about living with a flawed system. I’m talking about ignoring trading signals. If you are going to use a system, then trust it and obey it. If you don’t trust the system, then research its operation to identify its weaknesses and become confident that the system works. Then avoid trading when those weaknesses are apparent (say, during bear markets or during the afternoon session when volume tapers off).
Tip #6: Worried about a trade?
I remember planning to daytrade Intel (INTC) by shorting 2,000 shares of the stock at the open. I went to bed and worried about the trade. Why? Because the position size was double what I normally used. So I got up and reduced the size of the trade. That turned out to be a good idea because the trade lost money (I was right in the direction, but was flushed out when the stock spiked upward within minutes of the open).
A friend of mine had a similar problem. She was having difficulty sleeping through the night because of worries about her position in a mining stock. My advice to her was to cut the position size until her worries disappeared. If the stock still bothered her, then she should sell it completely. If you wake up in the early hours of the night and your first thought is of trading, then that is a good clue you have unresolved issues. This is especially true if sleepless-ness happens repeatedly. Do what it takes to eliminate that stress by making adjustments such as reducing your trading and investing more or moving into cash for a while. Or perhaps it’s time for a vacation.
Tip #7: Sell when the market says you’re wrong.
Keep that phrase in mind when looking at your losing positions. If the stock did not act as you expected it to, then sell. I like to have a diversified portfolio by owning several securities and diversifying by trading style. I may have some stocks that I am swing trading, some that I am position trading, and some that I am buying & holding.
The buy & hold stocks do not require much attention. That inattention can lead to problems when a cyclical stock goes out of favor. Perhaps the reasons for ownership have changed. If the company sells a division that removes a source of big profits, the stock could suffer, and it’s time to sell.
What sometimes happens is that I’ll buy a stock and it’ll act like I expected it to for a few weeks by moving higher. As soon as my focus turns elsewhere, the stock drops. The decline is not an in-your-face plunge of 50% in one session. Rather, the stock eases lower day by day, eating away the meager profit it once enjoyed. Soon, the position is losing money. The market is telling me I made a mistake. The transition from profit to loss is a wake-up call—a sell signal. Obey it.
Tip #8: Price drops 10% from a high.
A financial consultant I know told me that she uses a 10% rule to sell her blue-chip stocks. A blue-chip stock is a low-volatility, high-quality, high-volume security priced above $5. If it drops by 5% from a peak, it piques her interest. She will look at the fundamentals and try to understand the reason for the decline. If the market is dropping as part of a bullish move higher (a retrace in an uptrend), for example, she will ignore the temporary slump.
If the drop turns into a 10% decline from the peak, she will sell at least half, but most often, the entire position will go.
Tip #9: Market relative strength.
If you manage money for a living, either privately with your own portfolio or professionally by steering a hedge fund, your goal is to beat the competition. The competition is the market indexes.
One way to do that is to find stocks that are outperforming the market. Here’s what you do. Divide the closing stock price each day by the corresponding close in the S&P index (or the index of your choice, like the utility index for a utility stock, as an example). You should see one line on the chart. If the line slopes upward, your stock is out-performing the index. If it trends lower, the stock is performing less well.
This technique is what I call market relative strength since you are comparing the stock’s performance to the overall market. Sell stocks that are underperforming the market. I apply a moving average to the line (22 days is what I use) to smooth out the bumps so I can see the overall trend. The direction of the trend is what’s most important. Ideally, you want to have a portfolio of stocks that are climbing faster than the market.
Tip #10: Price breaks support.
I mentioned this stock (Figure 3, weekly scale) at the beginning of this article. The stock hit bottom at A in November 2012 and then it went on a tear. The stock climbed in a stairstep fashion until it bumped up against a ceiling. It slid horizontally for months, resting on a new floor at $12.
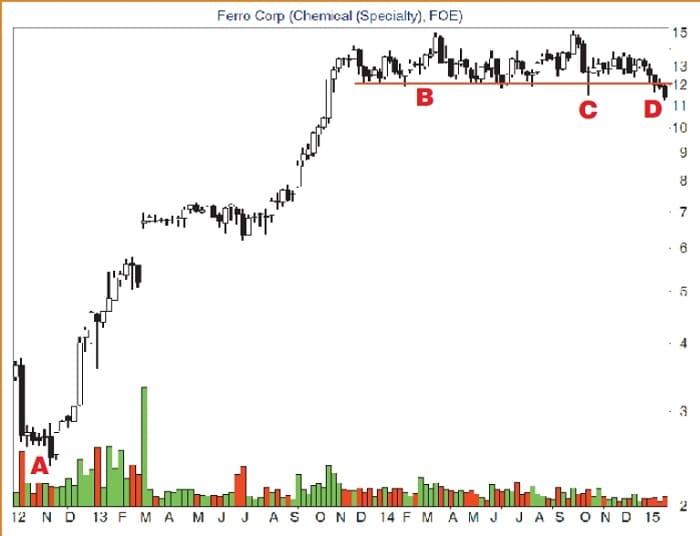
After such a big gain from the low at $2.38, I expected it to take an extended break. My hope was that the stock would continue higher, resuming the stairstep move up. When the stock poked its tail through support at C, it was not an automatic sale. I know that these types of false signals happen from time to time when the smart money tries to shake out the uninformed. I monitored the stock closely and decided to hold on. Fortunately, the stock recovered but still continued moving sideways.
Then the stock pushed through support at D and congested just below $12. It sat there for about two weeks. Again, I sat and waited just in case the move was trying to shake me out of a winning position. However, with the stock resting below support, it pushed me closer to the exit. I just needed a shove.
The push came when the stock dropped 5% in one day but closed slightly above the open. I decided to sell the following day. After buying the stock at $4.93, I sold it at $11.53 for a gain of 134%. The point of this anecdote is a simple one. When a stock breaks support, consider selling it. In Ferro’s case, it was time to let it go, so I sold. Timely selling is what this game is all about.
- Thomas Bulkowski is a private investor and trader with more than 30 years of market experience and considered by some to be a leading expert on chart patterns. He is the author of several books including Getting Started In Chart Patterns, Second Edition and The Evolution Of A Trader trilogy. His website and blog, www.thepatternsite.com, have more than 600 articles of free information dedicated to price pattern research.