Trading Articles
The Stepchild of Chart Patterns By Kenny Gilliland
The inverted cup with handle may be the chart pattern that does it for you, if only you’d let it! When I began studying technical analysis, I noticed that just about every chart formation had a counterformation. For example, the opposite of the double top was the double bottom. Or the head & shoulders formation had an opposite, the inverted head & shoulders. At first glance, one chart pattern did not seem to have an opposite — the cup with handle.
The cup with handle is a popular formation. We need only open up a copy of Investor’s Business Daily to find it referred to throughout the publication; essentially, it is the backbone of the IBD investing style. However, we would find no mention of the opposite formation in IBD or any of William O’Neil’s books — the inverted cup with handle (or icup). Some technicians recognize the icup as a legitimate chart pattern, but it is still often neglected by the general trading community. Traders should familiarize themselves with the icup for two important reasons. First, the pattern is a profitable pattern for short trading. Second, long-side traders can benefit from recognizing the pattern, as it could alert them that a forming double bottom could fail.
The Small icup’s Popular Cousin
The chart formation got its name because, you guessed it, it looks like a cup with a handle on the price chart. The pattern appears after a stock has trended upward approximately 20–30%, sometimes more, from an area of consolidation. After reaching a high point, the stock sells off. At some point, buyers and sellers are about evenly matched, and the stock makes a u-shaped pattern or saucer-like pattern. Ultimately, buyers begin to push the price upward. Just prior to retesting the previous high, the stock will pull back, but it will not undercut the bottom of the “cup.” This is considered to be the “handle.” A buy signal is generated when the price goes above the top of the handle.
Introducing The Inverted Cup With Handle
An icup is similar to the cup with handle, except it is upside down (Figure 1). It often appears in charts. Like other patterns, icups can show up covering any time period, be it one minute, five minutes, daily, weekly, monthly, or so on. As is generally the case, the longer the time frame, the more significant it is when the price confirms an upside/downside breakout. The ideal location to locate an icup is in a downtrending stock. What usually occurs is that a stock will initially make an intermediate or new low, then bounce upward in price. At some point, the stock will hit resistance and gradually lose steam, heading back down to retest the recent low. This is the basis of the cup.
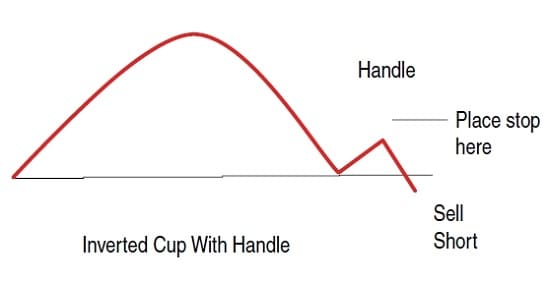
On the retest the stock will bounce, giving the appearance of a successful retest of the low. This may cause some to believe that a double bottom is in the making; they may purchase the stock before the double bottom has been confirmed, causing the price to increase. This results in the formation of the handle portion of the icup. Soon after, the move upward stalls and the price crashes through the low point of the handle. At this point, the pattern is completed and a sell short signal generated.
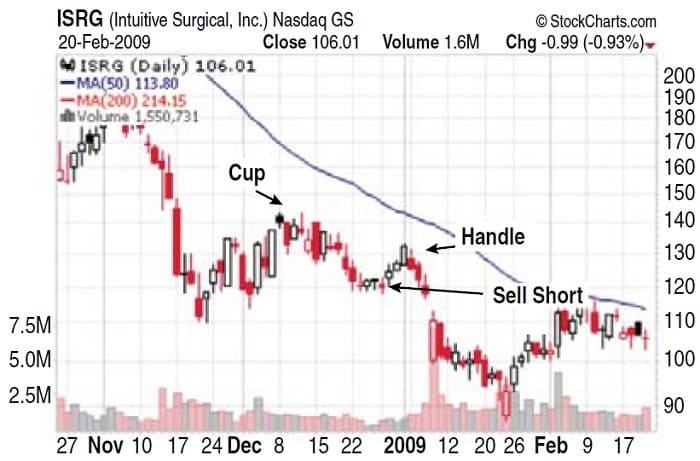
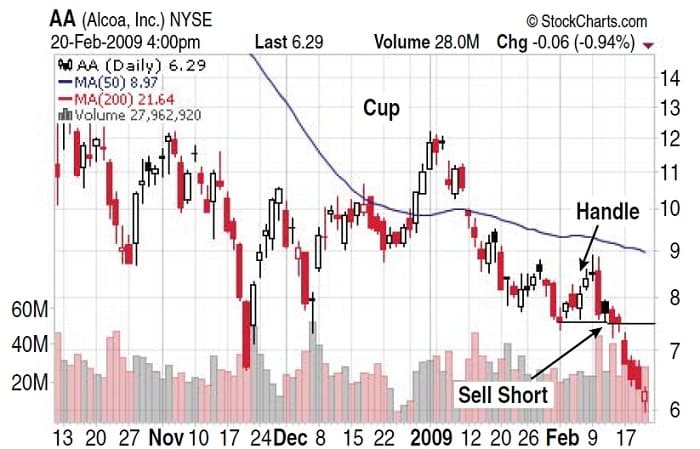
Ideally, the icup should be saucer or ovalshaped (Figure 2), but those that look like an inverted “V” can meet the specifications for an icup (Figure 3). Variance on the right brim of the cup is acceptable. Therefore, the right brim may not actually retest the price of the left brim, or it may even undercut it. One key distinction is that the handle should not rise above the top of the cup.
Suggested Books and Courses About Chart Patterns


To profit from the icup, a trader would place a sell-short stop order a few cents below the low point of the handle. Simultaneously, a buy to cover stop order should be placed at above the high end of the handle. While the pattern can be traded near a market top, it is advisable to trade the formation when a stock is trading below its 200-period moving average. Moreover, it is also advisable to trade the icup when the primary market trend is down.
As for price targets, prior to entering a trade, you should scan for areas of resistance that may cause a bounceback in price. The measuring rule is likely ineffective in trading this pattern. This rule states that a price objective should be based on the height of a pattern. Therefore, if the low of the cup is at $40 and the highest price reached in the pattern is $60, the profit objective would be $20 per share. According to Thomas Bulkowski in his Encyclopedia Of Chart Patterns, when trading the icup, the measurement rule is not an effective method for determining a profit target. Therefore, traders must be prepared to cover the short position if the trade has hit a resistance point.
Profit From icups
Despite its low profile, there is an abundance of icups throughout the various price charts that are waiting to be traded. I hope your interest has been piqued and you can profit from this chart pattern. Happy trading!
Kenny Gilliland is a long-time private trader.