Trading Articles
Whats Can You Expect, Mathematically? By Stephen Massel
Here’s a look at how mathematical expectation allows for an apples-to-apples comparison of trading systems or strategies regardless of type or style, as well as allowing the tracking of your own trading record. A huge number of different trading systems and strategies are available in the market today, all with their own particular focus, style, time frame, and risk. The type of trading you engage in is a very personal matter and depends on many factors. The things that need to be considered include the market you are interested in; the amount of time you have to do the required research and to execute and maintain your trades; your preferred time frame (which could be from seconds to months); the style of trading whether technical, fundamental, news driven, or purely discretionary; and of course, the size of your trading capital, leverage, and risk tolerance.
Some of these questions are easy to answer and some require more thought. Whether you are new to trading and are still deciding on your preferred style and considering different strategies or systems, or you are an experienced trader looking to analyze your own trading results or new systems, mathematical expectation should prove to be a very useful tool to have in your statistical toolbox. This article will define mathematical expectation and show how it allows for an apples-to-apples comparison of trading systems or strategies regardless of type or style, as well as allowing the tracking of your own trading record.
WHAT IS MATHEMATICAL EXPECTATION?
When assessing the past performance or backtested trading results of a system, there can be a whole array of metrics involved. Some of them can be compared directly, while others need to be looked at in conjunction with other metrics and an understanding of the underlying trading style. For example, a system that seeks to catch a trend may get stopped out a few times for small losses, and then catch a trend for a big win. Alternatively, a scalping system may trade more frequently with many small winning trades but lose big when a trade runs away from you. These two examples illustrate two of the most basic and important metrics when evaluating system performance:
- The win percentage which, as the name implies, is the number of winning trades as a percentage of total trades.
- The reward/risk ratio (R/R ratio), which is the profit target or amount gained versus amount risked or lost.
When looking at a trading system’s historical or backtested results, the average trade win/loss amounts can be used as an indication of the system’s R/R ratio:
Win% = (# Winning trades/# total trades) x 100 Reward/risk ratio = (Average win amount/average loss amount)
Example:
- A trend-following system may have a win% of 45% and an R/R ratio of 2.0
- A scalping system may have a win% of 70% and an R/R ratio of 0.9.
Which system performed better? Mathematical expectation (ME) will be able to answer that question. (See definitions.)
ME—Mathematical expectation, or expectancy.
ME = Win% x R/R ratio – Loss%
R/R Ratio—Reward/risk ratio. The ratio of profit target or trade gain and risk or trade loss. For historical trades, the ratio of average win and average loss.
Let’s start by considering the simple case of breakeven systems. All four of the combinations of win% and R/R ratios shown here result in a breakeven outcome. Mathematical expectation basically describes the relationship between these two key metrics:
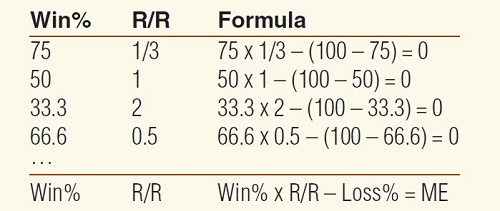
Take the 50% example, which could be a coin-toss game where you make $1 every time heads comes up and lose $1 every time tails comes up. It is easy to see that over time you would most likely break even. In seeking a formula that describes these systems, it can readily be seen that win% x R/R – loss% fits the bill. This formula is known as the mathematical expectation (ME), or expectancy.
APPLICATION TO SYSTEMS
An example of a non–breakeven system is the game of roulette. Take the case of a bet on a single number. In the US version of the game, there are 36 red or black numbers, a zero, and a double zero. So on the spin of the wheel, the chance of any one of these outcomes is 1 in 38. The payout, however, is only 35 chips per chip wagered. In the case of betting on red or black, the chances of being correct are 18 out of 38, and the payout is 1 for 1. Putting these numbers into the formula yields:
- Single number bet (1/38): 2.63 x 35 – (100 – 2.63) = -5.3
- Red/black bet (18/38): 47.37 x 1 – (100 – 47.37) = -5.3
This indicates a 5.3% margin to the house for both bets, and so, over time, a losing system. We can now apply the ME formula to evaluate the trading system examples. Simply insert the win% and R/R ratios previously obtained into the ME formula:
- Trend system: 45 x 2 – (100 – 45) = 35
- Scalp system: 70 x 0.9 – (100 – 70) = 26
We can now see that the trend system is the better performer.
Suggested Books and Courses About Money Management
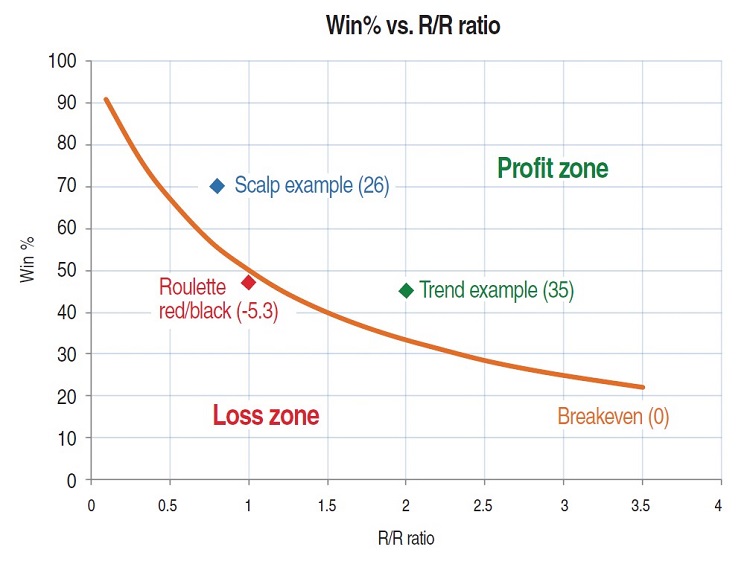
Figure 1 shows where the trend system (green), scalp system (blue), breakeven curve (orange), and roulette system red/black bet (red) exist within the win% and R/R ratio space. The ME, therefore, is a good way of comparing completely different systems based on their win% and R/R ratios. It gives a measure of how far away you are from breakeven. Obviously, the higher the number, the better it is; above 30 is generally considered good.
APPLICATION TO YOUR OWN TRADING
Mathematical expectation is also a very good way to measure your own trading performance. Simply list your trades (you should have at least 30 trades in order to be statistically meaningful) and calculate the win% (100 x number of winning trades/total number of trades). Then separate out your winning and losing trades and find the average profit and loss for each. Divide profit average by loss average to get the R/R ratio.
If the dollar size of your wager is an intrinsic part of your trading method, then you can use the average dollar profit and loss amounts. However, if you are looking to evaluate the pure performance of the strategy independent of varying wager size, I suggest you use the difference between trade entry price and exit price as a percentage instead (this will avoid any adverse influence from unusually high or low wagers).
Maintaining a moving average (say, 30) of this figure will allow you to track your trading strategy over time that is decoupled from your equity curve. Mathematical expectation can also be applied prior to placing a trade. Let’s say you are considering a certain trade for which you can estimate the probability of a successful outcome, either from experience or as defined by your strategy. Once you have selected the stopout level (risk) and profit target, you can apply the formula to calculate the ME of the trade.
IS YOUR SYSTEM PROFITABLE?
There are many important metrics to consider when evaluating the suitability of a trading system or strategy, for example maximum drawdown, average trade return, and standard deviation, to name just a few, but I would say that one of the first and most basic things to evaluate is the mathematical expectation. This will provide a measure of the historical profitability or the distance away from breakeven of one system versus another or of your own trading record.
Of course, in evaluating historical returns, the ME is looking backward, and there is no guarantee that a trading system or strategy will continue generating returns based on its backtested or historical record. Metrics such as forward-test results, variable sensitivity analysis, and system robustness measures, among many others, need to be examined in order to gain confidence in the probable continued performance of a system, as well as a clear plan to monitor and act upon deviations from the expected results.
Stephen Massel has been trading stocks and futures and developing strategies and indicators in Wealth-Lab and other applications for more than 15 years. He is the head of capital markets at Applabs, a software testing company.