Trading Articles
Chart Pattern Verification: A Structured Confirmation Framework

In this article, you were introduced to an unconventional concept of stock price motion. Before applying the resulting price-motion model you must develop confidence in it-and that is part of the purpose of this article. If the “X motivation” concept is valid, it must be able to explain the existence and reoccurrence of common chart patterns-and why they impart information to the investor. Thus, reconciliation of the model with the precepts of charting is strong evidence of the validity of the model-which adds to confidence in usage.
The second purpose of the article is to show you how the price-motion model can be used to resolve chart patterns. Such patterns can be used to help determine the status of cyclic activity, and this in turn can be used to determine which way and when price motion will go at pattern termination. For those of you that are unfamiliar with chart patterns, reference is provided in the bibliography to several good books on the subject.
WHY TREND LINES AND CHANNELS FORM-AND REPEAT
These are two of the very most basic tools of the chartist. The chartist will note two or more consecutive fluctuation lows, and if each one occurs at a higher price level, he will draw an “uptrend” line connecting or just below them. Similarly, he will draw a “downtrend” line connecting or just above two or more consecutive fluctuation highs when each successive high is at a lower price level. He will then draw upon the adage that “trends tend to persist,” and expect the uptrend or downtrend to continue-until the trend line is broken.
Furthermore, our chartist will often note a situation where prices are generally trending in one direction or another, but appear to bounce back and forth between two imaginary, parallel lines. He will draw these lines in on the chart and call them a channel.
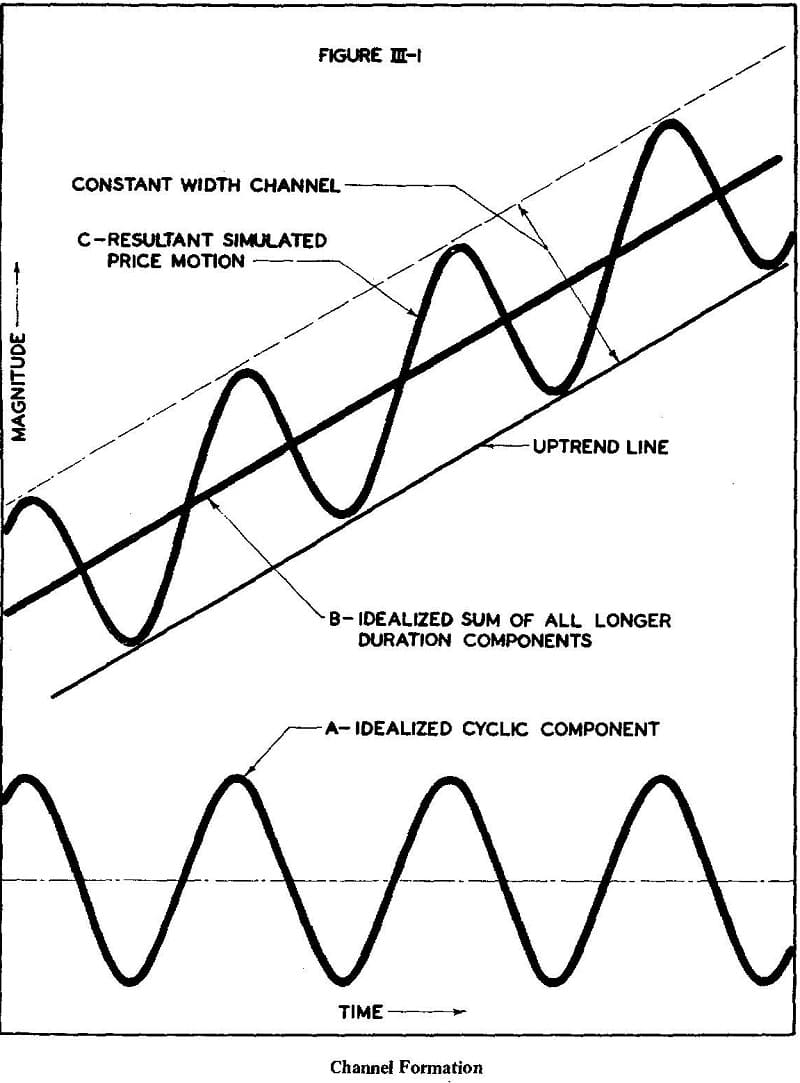
In Figure III-I we have extracted the simplest possible set of elements from our model. One of our cyclic components (any one) is shown at “A.” It is assumed that all longer duration components sum for the time being to the straight line at “B.” At each point in time, the price values of “A” and “B” are added to get the resultant, “C.” As a result of this highly simplified extraction from our model, both an uptrend line and an up-trending channel are formed!
Advanced Books and Courses on Technical Analysis


Trend lines and channels have often been described in awe-filled tones, for it does sometimes seem like magic when stock prices consistently reverse themselves at channel or trend line boundaries almost as if these were very real constraints. At this point, however, we can see that there is no magic to it at all: It is simply the natural result of the existence of “X” cyclicality !
WHERE HEAD AND SHOULDER PATTERNS COME FROM
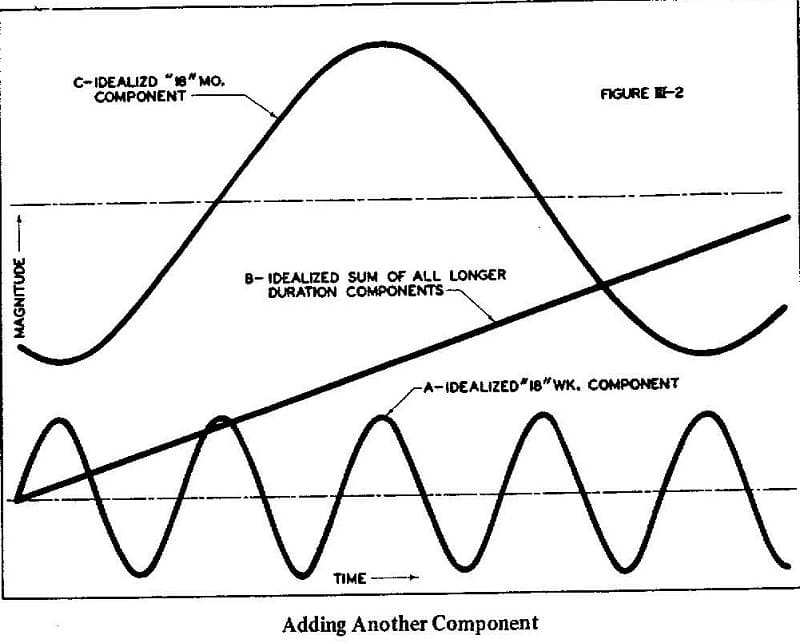
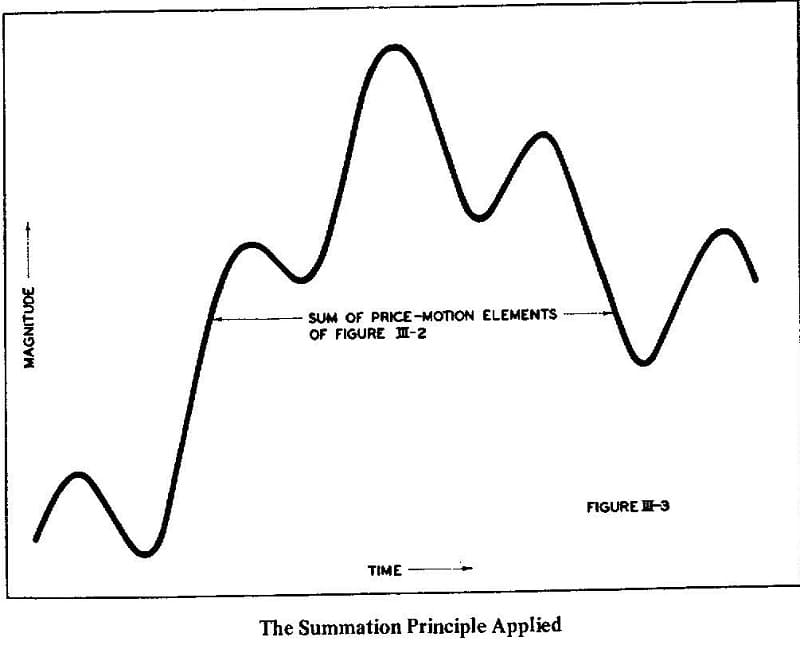
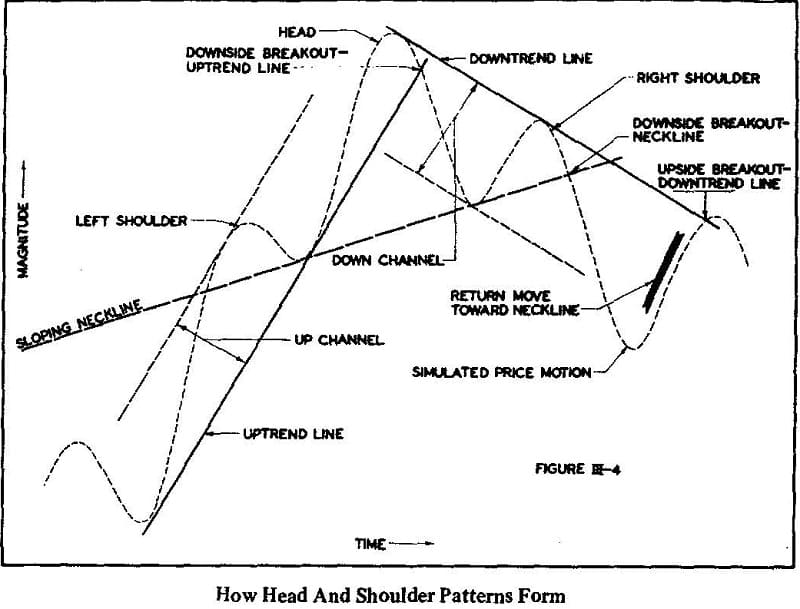
Now we will add just a little more complexity to our simulated price action. In Figure III-2, we see two of the cyclic elements of our model at “A” and “C.” The magnitude and duration relationships between these are approximately those that our model says should exist between the 18-week and 18-month periodicities. As before, we will not clutter up the picture with any other cyclic activity, and will assume that all regularities of longer than 18 months duration sum to the straight line at “B.” Again we will add the value of all three together for each interval of time and show the results as Figure III-3. Quite a complex bit of price motion for such a simple beginning, isn’t it? Imagine what it’s like with all 12 periodicities at work-and with fluctuation of magnitude and duration added! Now let’s put a few of the chartist’s favorite lines in place in Figure III-4.
Pay Dirt!
Almost everywhere we look we see a chart pattern of traditional significance! An uptrend line and a downtrend line both appear. These are each parts of short up and down channels respectively. Both downside and upside breakouts from trend lines are present, and in each case forecast what the chartist says they should a reversal of trend! Another charting favorite also strikes the eye. The head and shoulder pattern is a classic one with a sloping neckline. The downside breakthrough confirms the trend reversal called by the previous breakthrough the uptrend line, and calls for further downside activity. The oft-noted “return move” to or near the neckline is present, followed (as per tradition) by further downside activity. All of this from an almost ridiculously simplified version of our price-action model!
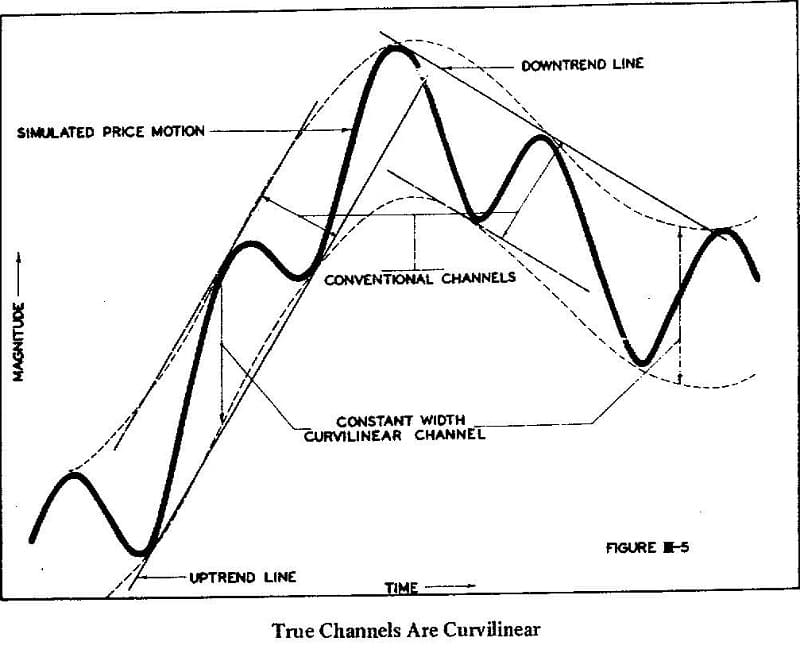
Let’s pause a moment and discuss what we’ve seen happen. Direct your attention to Figure III-5. The simulated price motion of Figure III-3 is reproduced here. but this time with our constant-width envelope of earlier chapters added. The constant-width envelope phenomenon is seen to be a mandatory outgrowth of the cyclic model!
Obviously, when all fluctuations completely fill such an envelope over any given period of time, the magnitude-duration fluctuations for the intra-channel cyclic component must be fill for this time period. And indeed, this is exactly what Figure IIl-5 shows, and exactly the way the simulated price motion was formed in this case! Furthermore, when the fluctuations do not fill such an envelope, we are warned that such magnitude-duration fluctuations are forming up.
Now note the overlay in Figure III-5 of the previously remarked up and down trend lines and associated up and down channels. It is easy to see here that the chartist’s trend lines and channels are simply straightened-out segments of our constant-width envelope boundaries, which actually are curved! Clearly, when a longer duration cycle than the one contained within the channel begins to turn over, our curvilinear channel turns also, and prices quickly “break” through the chartist’s trend lines and channel boundaries. His assumption, therefore, that this indicates a major price reversal is founded on the facts that:
- A long duration cycle has caused the effect, hence it will be quite long before the previous trend is resumed!
- A long duration cycle has large magnitude associated with it, hence the amount of price motion in the reversal is apt to be quite large!
Over the years, chartists have noted that such breakthroughs are usually followed by a significant reversal: this information has been obtained empirically. Through the application of our model, we now have shown how and why it happens from a purely theoretical standpoint. Our results and the chartist’s observations are quite in agreement!
The case is similar for a head and shoulder formation. We can readily see (Figure IIl-4) that the neckline the chartist draws is in this case simply a second uptrend line. The preceding uptrend line connected the first two cyclic lows in this figure. When this trend line was broken on the downside, followed by a third cyclic low, then the second and third lows formed a new trend line, with sharply reduced upward slope.
This is merely a rather crude way of causing the straight-line segments of the chartist to conform to the curving channel that we now know exists! In fact, a head and shoulder pattern must be formed as a consequence of our price-motion model as price motion is turned by a longer duration component, so long as the time relationship of the two components in question is similar to that shown in Figure III-2, from which Figure 111-4 was derived!