Trading Articles
Using The RSI By Danish Kapur
There are several misconceptions about the relative strength index. Let’s get rid of them. What I really like about the relative strength index (RSI) is its divergence characteristic, which warns a trader about an upcoming trend change. I would, first of all, like to put some light on the RSI before explaining how to use it.
RSI Indicator
The RSI is an indicator oscillating between zero and 100. Levels close to zero indicate that the stock is oversold and due for a bounce back, while levels close to 100 indicate that the stock is overbought and due for a reaction. However, it is possible for a stock to remain oversold or overbought for a relatively long period.
Typically, the RSI will oscillate between levels of 30 and 70. There is a common misconception among many traders that higher levels of the RSI indicate that the stock should be sold and lower levels indicate that the stock should be bought. A trader who buys and sells based on this theory is bound to fail sooner or later. This is because, as I mentioned, the stock could remain overbought or oversold on the RSI for a long period, and the price of stock may rise by as much as 200% to 300% while it is in overbought territory or fall as much as that while it is in oversold territory. So selling the stock just because its RSI has hit 70 may not be ideal.
TRADING THE RSI
I will show you how I usually trade with the RSI. Note this example is a long-term trade. The first and foremost factor I pay attention to is price trend. If the trend is up, then in no way am I going to sell the stock, even if the RSI is 70 or more. I would like to find the opportunities to buy the stock, and if the RSI is 70 or more, it will make me more confident that the uptrend is strong and roaring. If the trend is down and the RSI is somewhat close to 30 or less, I would definitely look for areas to sell the stock short. It is possible the RSI remained at 30 or moved up while the stock kept declining.
As I stated before, what I really like about the RSI is its ability to show divergence. The divergence makes me wary of upcoming trend changes. I get on my feet to look for the first sign of a trend change in terms of price and then reverse the trade or simply book profits and stay on sidelines. So what is divergence? Divergence is when the stock price keeps rising sharply but the RSI, instead of rising, keeps falling. This is suggestive of the maturity of the uptrend. It does not necessarily mean you should get out of the trade. As I mentioned, the most important thing to pay attention to is price. Until price shows a change in trend, stay put. A divergence between price and the RSI tells you that you should be extremely cautious. The moment that price shows a change in trend, it is time to reverse your trade or book profits and stand aside without a second thought. At that point, the warning from the RSI divergence has been confirmed by price movement.
Suggested Books and Courses About Market Indicators


Here’s an example. In Figure 1 you see a chart of Tata Steel (listed on the National Stock Exchange in India) from October 1998 to October 2008. In early 2001, the price made a swing top around 100 (shown by P1) and correspondingly, RSI (14) also topped around 70 (shown by R1). Later, both declined in unison until RSI hit 30. Later, in mid-2003, the stock crossed its 2001 swing high and the RSI also crossed its 2001 high of 70, making traders confident that the up move was indeed genuine.
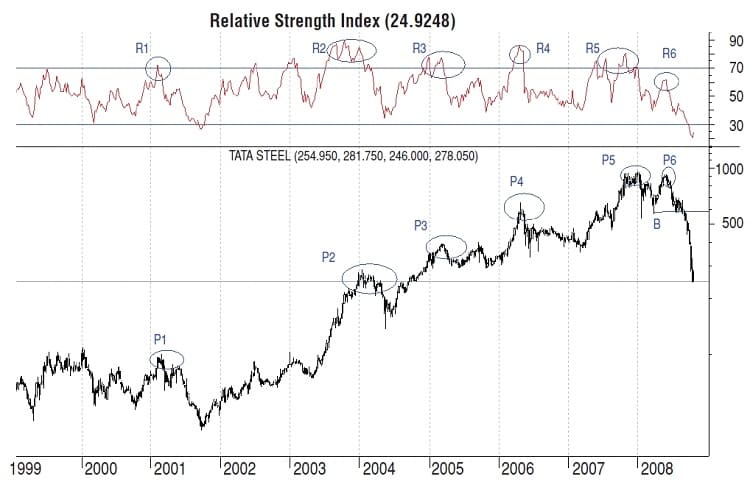
Had you sold your positions when the RSI touched 70, you would have missed a great opportunity. The RSI moved from 70 to 90 while the stock price moved from 100 to almost 288 (almost three times) between July 2003 and January 2004. It is important to note that the RSI remained in the narrow band between 76 and 90 (shown by R2), while the stock price, during the same time period, moved from 118 to 288 (P2). This is a classic example of why it is best to not try to buck the trend till the price shows a change in trend.
Let’s see what happened next. In the middle of 2004, the price and the RSI declined, but the trend was still up. In early 2005, price made a new high (P3), but the RSI failed to make a new high or even get close to its previous high (R3 is lower than region R2). This should have made you cautious, but at this point there was still no confirmation from price about a change in trend, so you would keep holding your long position.
In 2006, the stock price again made a new high of about 658 (P4), and this time, RSI (R4) also went higher than R3. Whew!In 2008 the stock price made another new high (P5), whereas the RSI (R5) showed sluggish movement around the same region (R4) as before. This should make us a little cynical because the price was making new highs, but the RSI was fizzling around the same regions again and again and not able to sustain higher levels. All I need to do is look for confirmation from the stock price of a change in trend before I book my profits. From the chart you can see that the price declined in early 2008 and the RSI also declined, but still there was no confirmation that the trend changed. So I stay put.
The stock remained strong and again went higher (P6), but what was important is that the RSI went considerably lower (R6). When price went below the previous low at B, it indicated a change in trend and I got out of my long positions. There were enough warnings from the RSI and price suggesting a change in trend. After this the RSI went lower to around 30. But just because the RSI was below 30 didn’t mean the stock was oversold and it was okay to take long positions. As you can see, the RSI went even lower and the price continued going lower as well. Until the price confirmed that the downtrend was over, you should not have opened any long positions. I would like to draw your attention to how quickly price corrected to the P2 levels after that first divergence in the RSI at R2. Sooner or later, divergence is going to play its part. It is just a matter of time.
INDICATORS AS TOOLS
The purpose of this article was to remove the misconceptions among traders about the relative strength index. What is more important is to pay attention to price and use the indicators as tools to give you either helpful warnings or make you feel more confident in your trading decisions.
Danish Kapur is a trader and follows both Indian and US markets. He is studying for his master’s in business administration at Baruch College, New York, and holds a bachelor’s degree in technology in electronics and communication engineering.